DOI:https://doi-0004.org/6812/17927407632017
Yazid MOURAD1, Tarek KHATER2, Fouad Rekik3
1University of Batna 1, Algeria, E-mail: mourad.yazid@ensf.dz
2University of Batna 1, Algeria, E-mail: tarek.khater@univ-batna.dz
3Laboratory of Environment Health and Animal Production (LESPA), University of Batna 1, Algeria, E-mail: fouad.rekik@univ-batna.dz
Received: 17/09/2026 ; Published: 23/10/2026
Abstract
Egg prices are influenced by long-term trends, seasonal fluctuations, and short-term volatility, creating uncertainty for market stakeholders and policymakers. This study analyzes these price dynamics in Aïn Touta, Algeria, using 624 weekly observations from 2013 to 2025. Descriptive statistics, trend analysis, seasonal decomposition, volatility measures, and ARIMA models were employed. The overall average price was 358.60 DZD, ranging from 140 to 620 DZD, with a coefficient of variation of 25.87%. A significant upward trend was observed, with an average annual increase of 14.93 DZD (p = 0.0072; R² = 0.4961). The mean annual price rose from 202.18 DZD in 2013 to 401.58 DZD in 2025, while the highest peak occurred in 2023 (501.79 DZD). Significant monthly seasonality was identified (ANOVA, p = 0.000614), with prices generally lower in spring and higher in autumn and early winter. May had the lowest average monthly price (329.68 DZD), while December recorded the highest (397.66 DZD). In contrast, differences between weeks within the same month were not significant (p = 0.9386). Average weekly volatility was 6.36%, with extreme swings of +36.87% and −46.11%, particularly pronounced during 2020–2021.For forecasting, 499 observations were used for training and 125 for independent testing. The ARIMA(1,1,2) model achieved a MAE of 70.36 DZD, RMSE of 81.87 DZD, and MAPE of 16.63%, outperforming the tested SARIMA model (MAPE = 24.89%). The Ljung–Box test revealed no significant residual autocorrelation, although residuals were non-normally distributed.Overall, egg prices in Aïn Touta are characterized by a significant long-term upward trend, pronounced seasonality, and time-varying volatility. The ARIMA(1,1,2) model provides moderate forecast accuracy and offers a relevant basis for short-term egg price prediction.
Keywords: Egg prices; Aïn Touta; Algeria; time series; seasonality; price volatility; ARIMA; forecasting.
1. Introduction
Eggs are an important source of affordable, high-quality animal protein and constitute a major component of food consumption worldwide. Their economic importance extends beyond nutrition, as egg production depends on a complex value chain involving feed, breeding stock, energy, veterinary inputs, labour, transport, and marketing. Consequently, egg prices may respond to changes in production costs, supply availability, consumer demand, and seasonal market conditions. The Food and Agriculture Organization of the United Nations (FAO) identifies feed costs, production conditions, seasonal demand, and market competition as important factors influencing poultry and egg markets (FAO, 2003).
In Algeria, the poultry sector has become an important component of the agricultural and food system following several decades of development of intensive production systems. The sector has achieved substantial production capacity, including a high level of domestic table-egg availability. However, Algerian poultry production remains strongly dependent on imported inputs, particularly feed ingredients such as maize and soybean meal, as well as breeding stock and other production inputs. This dependence exposes producers to changes in international commodity prices and contributes to uncertainty in production costs and market conditions (Alloui & Bennoune, 2013; Kaci, 2022).
Feed represents a particularly important component of egg-production costs. In an industrial egg-production farm in Algeria, Belaid-Gater et al. (2019) reported that feed costs accounted for more than 60% of production costs and highlighted the importance of feed consumption and feed-conversion efficiency for farm profitability. Using long-term production records from an Algerian laying-hen complex, Belaid-Gater et al. (2023) further demonstrated substantial variation in egg production over time and emphasized the role of production performance and technical management in determining egg availability. These structural characteristics indicate that egg prices may reflect not only changes in consumer demand but also variations in production costs, supply conditions, and production performance.
Despite the importance of these factors, relatively little attention has been given to the temporal behaviour of egg prices at the local-market level in Algeria. Existing Algerian studies have primarily examined poultry production systems, technical performance, feed efficiency, and structural constraints rather than high-frequency price dynamics (Alloui & Bennoune, 2013; Belaid-Gater et al., 2019, 2023; Kaci, 2022). Consequently, the evolution of egg prices over time, including long-term trends, seasonal patterns, short-term volatility, and extreme price movements, remains insufficiently documented.
Evidence from other egg-producing markets indicates that prices can exhibit pronounced temporal and seasonal patterns. Pandian et al. (2011), for example, identified significant seasonal and temporal variation in wholesale and retail egg prices across major market centres in South India, with relatively lower prices during spring and higher prices during late autumn and winter. More recently, Pradheeshwaran et al. (2025) reported persistent seasonal patterns in egg prices across 28 Indian market centres during 2013–2024, with prices generally increasing during monsoon and winter periods and declining during summer. Such findings demonstrate the importance of analysing egg prices at sufficiently high temporal resolution to distinguish persistent trends from recurring seasonal movements and short-term fluctuations.
Time-series analysis provides an appropriate framework for this purpose because it allows different dimensions of price behaviour to be examined within a common chronological structure. Trend analysis can quantify the direction and magnitude of long-term price changes, while seasonal analysis can identify recurring intra-annual patterns. Volatility measures can further characterise short-term instability and identify periods associated with unusually large price movements. In addition, forecasting models can assess the extent to which historical price information can be used to predict future market conditions.
Among classical forecasting approaches, autoregressive integrated moving average (ARIMA) models are widely used for economic and agricultural time series because they can account for temporal dependence, non-stationarity through differencing, and serially correlated errors (Box et al., 2015; Hyndman & Athanasopoulos, 2021). Their application to agricultural and food-price forecasting has demonstrated their usefulness as baseline forecasting models, although their performance may decline when price series contain abrupt shocks or nonlinear fluctuations. Forecast accuracy should therefore be assessed using an independent testing period rather than relying exclusively on in-sample model fit (Hyndman & Koehler, 2006).
Against this background, there is a clear need for high-frequency empirical evidence on egg-price dynamics in Algerian local markets. In particular, the simultaneous assessment of long-term trends, seasonal behaviour, short-term volatility, extreme price movements, and forecasting performance remains limited. Addressing these dimensions within a single analytical framework can provide a more complete understanding of how local egg prices evolve over time.
The present study therefore investigates weekly egg-selling prices recorded in Aïn Touta, Batna Province, Algeria, from 2013 to 2025. The analysis is based on 624 chronological weekly observations and aims to: (i) characterise overall and annual price variability; (ii) quantify the long-term price trend; (iii) examine monthly and intra-month seasonal patterns; (iv) assess short-term price volatility and extreme price movements; and (v) develop and evaluate an ARIMA-based forecasting model using an independent out-of-sample testing period.
By integrating descriptive statistics, trend analysis, seasonal assessment, volatility analysis, and time-series forecasting, this study provides a high-frequency assessment of egg-price dynamics at the local-market level. The findings contribute to the limited literature on egg-price behaviour in Algeria and provide quantitative evidence that may support market monitoring, short-term planning, and decision-making by producers, traders, consumers, and policymakers.
2. Materials and Methods
2.1. Study Site
The study was conducted in Aïn Touta, a commune located in Batna Province, northeastern Algeria. Aïn Touta is an important local urban and commercial centre and was selected as the study area because a continuous historical series of egg-selling prices was available for a relatively long period. The analysis focused specifically on the local egg market in Aïn Touta; therefore, the results describe local price dynamics rather than the national Algerian egg market.
2.2. Data Collection and Dataset Construction
The study used historical egg-selling prices recorded in the local market of Aïn Touta from January 2013 to December 2025. The original database contained 156 monthly records, with four weekly observations for each month, resulting in 624 weekly observations.
All prices were expressed in Algerian dinars (DZD). The observations were organised chronologically according to year, month, week, and observation date. Before analysis, the dataset was checked for missing values, duplicate records, inconsistent dates, and invalid price values. The final dataset contained 624 observations with no missing or duplicated records.
The weekly price series was denoted by Yₜ, where Yₜ represents the egg price observed at week t, with t = 1, 2, …, 624. The original chronological order was maintained throughout the analysis.
2.3. Descriptive Statistical Analysis
Descriptive statistics were calculated for the complete dataset and for annual and monthly groups. The arithmetic mean was calculated as:
Mean = ΣYₜ / n
where Yₜ is the egg price at time t and n is the number of observations.
The sample standard deviation (SD) was calculated as:
SD = √[Σ(Yₜ − Mean)² / (n − 1)]
Price variability relative to the mean was assessed using the coefficient of variation:
CV (%) = (SD / Mean) × 100
Minimum, maximum, median, and mean values were also calculated to describe the distribution and temporal variability of egg prices.
2.4. Annual Price Variation and Long-Term Trend
Annual mean prices were calculated from the weekly observations recorded during each calendar year. Year-to-year changes were expressed as percentages:
Annual Change (%) = [(Meanₜ − Meanₜ₋₁) / Meanₜ₋₁] × 100
where Meanₜ is the annual mean price in year t and Meanₜ₋₁ is the annual mean price in the preceding year.
The long-term trend was evaluated using ordinary least-squares linear regression:
Yₜ = β₀ + β₁t + εₜ
where Yₜ represents the annual mean egg price, β₀ is the intercept, β₁ is the estimated annual trend, t is the time index, and εₜ is the error term. The coefficient β₁ represents the average annual change in egg price.
The hypotheses were:
H₀: β₁ = 0
H₁: β₁ ≠ 0
A p-value below 0.05 was considered evidence of a statistically significant trend. The coefficient of determination was calculated as:
R² = 1 − [Σ(Yₜ − Ŷₜ)² / Σ(Yₜ − Ȳ)²]
where Ŷₜ is the fitted value and Ȳ is the mean annual price. A 95% confidence interval was also calculated for the estimated regression slope.
2.5. Seasonal Analysis
Seasonal variation was assessed using the 12 calendar months. Monthly mean prices were calculated by pooling all weekly observations belonging to the same calendar month across the 2013–2025 study period.
A monthly seasonal index was calculated relative to the overall mean:
Seasonal Indexₘ = (Meanₘ / Overall Mean) × 100
where Meanₘ is the mean price for month m and Overall Mean is the mean price calculated from all 624 observations. A seasonal index of 100 indicates a price equal to the overall average, whereas values above or below 100 indicate relatively higher or lower prices, respectively.
Monthly differences were statistically evaluated using one-way analysis of variance (ANOVA). The model was expressed as:
Yᵢⱼ = μ + αᵢ + εᵢⱼ
where Yᵢⱼ is the j-th observation in month i, μ is the overall mean, αᵢ is the effect of month i, and εᵢⱼ is the residual error.
The null hypothesis was:
H₀: μ₁ = μ₂ = … = μ₁₂
The ANOVA statistic was calculated as:
F = MSbetween / MSwithin
When the ANOVA was statistically significant (p < 0.05), Tukey’s honestly significant difference (HSD) test was used for pairwise comparisons.
The same procedure was applied to the four weekly positions within each month (Week 1–Week 4) to determine whether prices differed according to their position within the month.
2.6. Weekly Price Changes and Volatility
Short-term price movements were assessed using weekly percentage changes and logarithmic returns. The weekly percentage change was calculated as:
ΔPₜ (%) = [(Yₜ − Yₜ₋₁) / Yₜ₋₁] × 100
Logarithmic returns were calculated as:
rₜ = ln(Yₜ / Yₜ₋₁)
The mean absolute weekly percentage change was calculated as:
Mean Absolute Change (%) = Σ|ΔPₜ| / (n − 1)
Overall weekly volatility was measured using the standard deviation of logarithmic returns:
Weekly Volatility (%) = SD(rₜ) × 100
The maximum and minimum weekly percentage changes were also identified to detect extreme price movements.
To examine changes in volatility over time, a 12-week rolling standard deviation of log returns was calculated:
Rolling Volatilityₜ = SD(rₜ₋₁₁, …, rₜ)
Annual volatility was also calculated separately for each calendar year. These measures allowed periods of elevated short-term instability to be identified independently of the general price level.
2.7. Stationarity and Time-Series Identification
Before forecasting, the weekly price series was examined for stationarity using the Augmented Dickey–Fuller (ADF) test (Dickey and Fuller, 1979). The test evaluates the null hypothesis that the series contains a unit root against the alternative hypothesis of stationarity.
The general ADF model was specified as:
ΔYₜ = α + βt + γYₜ₋₁ + ΣδᵢΔYₜ₋ᵢ + εₜ
where ΔYₜ is the first difference of the series, α is a constant, βt represents the deterministic time trend, γ is the unit-root coefficient, δᵢ represents coefficients of lagged differences, and εₜ is the error term.
When the original series was non-stationary, differencing was applied until stationarity was achieved. The number of differences was represented by d in the ARIMA(p,d,q) model. Autocorrelation function (ACF) and partial autocorrelation function (PACF) plots were also examined to support model identification.
2.8. ARIMA and SARIMA Forecasting
Egg-price forecasting was performed using autoregressive integrated moving average (ARIMA) models. ARIMA models combine autoregressive, differencing, and moving-average components and are widely used for univariate time-series forecasting (Box et al., 2015; Hyndman and Athanasopoulos, 2021).
An ARIMA model is denoted as ARIMA(p,d,q), where p is the autoregressive order, d is the order of differencing, and q is the moving-average order. Its general form is:
φ(B)(1 − B)ᵈYₜ = c + θ(B)εₜ
where B is the backshift operator, φ(B) represents the autoregressive component, θ(B) represents the moving-average component, c is a constant or drift term, and εₜ is the error term.
The backshift operator is defined as:
BYₜ = Yₜ₋₁
and first-order differencing as:
ΔYₜ = Yₜ − Yₜ₋₁
Several candidate ARIMA specifications were evaluated using model diagnostics and information criteria. The Akaike Information Criterion (AIC) was calculated as:
AIC = −2 ln(L) + 2k
where L is the maximised likelihood and k is the number of estimated parameters. Lower AIC values indicate a preferable balance between model fit and complexity.
Because the exploratory analysis indicated seasonal variation, a seasonal ARIMA model was also evaluated:
SARIMA(p,d,q)(P,D,Q)ₛ
where P, D, and Q represent the seasonal autoregressive, differencing, and moving-average orders, respectively, and s represents the seasonal period. The seasonal and non-seasonal models were evaluated using the same independent testing period.
2.9. Training and Testing Procedure
The 624 weekly observations were divided chronologically into 499 training observations (approximately 80%) and 125 testing observations (approximately 20%).
The training period covered 1 January 2013 to 15 May 2023, while the independent testing period covered 22 May 2023 to 22 December 2025.
The models were fitted exclusively to the training data, and forecasts were subsequently generated for the 125 observations in the testing period. Random shuffling was avoided because it could allow information from future observations to enter the training dataset and produce overly optimistic estimates of forecasting performance.
2.10. Forecast Accuracy and Model Selection
Forecasting performance was assessed using mean absolute error (MAE), root mean square error (RMSE), and mean absolute percentage error (MAPE), following Hyndman and Koehler (2006).
The MAE was calculated as:
MAE = Σ|Yₜ − Ŷₜ| / n
The RMSE was calculated as:
RMSE = √[Σ(Yₜ − Ŷₜ)² / n]
The MAPE was calculated as:
MAPE (%) = [Σ(|Yₜ − Ŷₜ| / |Yₜ|) / n] × 100
where Yₜ is the observed price and Ŷₜ is the forecasted price. Lower MAE, RMSE, and MAPE values indicate better forecasting performance.
Model selection was based primarily on out-of-sample forecasting accuracy, supported by information criteria and residual diagnostics. This approach ensured that the selected model was evaluated according to its ability to predict observations that were not used during model estimation.
2.11. Residual Diagnostics
Residual diagnostics were performed to determine whether the selected model adequately captured the temporal dependence in the price series. Residuals were calculated as:
eₜ = Yₜ − Ŷₜ
The Ljung–Box test was used to assess residual autocorrelation. The test statistic was calculated as:
Q = n(n + 2) Σ[rₖ² / (n − k)]*
where n is the number of residuals, rₖ is the residual autocorrelation at lag k, and h is the maximum lag considered, with the summation performed from k = 1 to h.
The null hypothesis was that no significant autocorrelation remained in the residuals. A p-value greater than 0.05 indicated insufficient evidence of residual autocorrelation. The test was evaluated at lags 10, 20, and 30.
Residual normality was assessed using the Shapiro–Wilk test, supplemented by visual inspection of residual distributions. A p-value below 0.05 indicated a statistically significant departure from normality. Because occasional extreme market movements may produce non-normal residuals, normality was considered a secondary diagnostic criterion rather than a strict requirement for point forecasting.
All statistical tests were conducted at a significance level of α = 0.05. Therefore, p-values below 0.05 were considered statistically significant.
Results and Discussion
3.1. Descriptive Characteristics of Egg Prices
The dataset comprised 624 weekly egg-price observations from Aïn Touta, Batna Province, covering January 2013–December 2025. No missing or duplicated observations were identified. Across the study period, the mean weekly price was 358.60 DZD, with a median of 360.00 DZD. Prices ranged from 140.00 to 620.00 DZD, while the standard deviation was 92.79 DZD, corresponding to a coefficient of variation (CV) of 25.87% (Table 1). These values indicate substantial temporal variability in the local egg market.
Annual averages varied considerably (Table 2). The mean price increased from 202.18 DZD in 2013 to 395.31 DZD in 2015, declined during 2016–2017, and subsequently increased to 427.92 DZD in 2019. A marked reduction occurred in 2020, when the annual mean fell to 281.84 DZD, followed by a sustained recovery during 2021–2023. The highest annual mean, 501.79 DZD, was recorded in 2023, before declining to 417.19 DZD in 2024 and 401.58 DZD in 2025.
The variability of prices also differed among years. The annual CV ranged from 6.44% in 2015 to 25.84% in 2013, indicating that price level and price instability did not necessarily evolve together. Similar instability in the Algerian egg market has been associated with fluctuations in production and farm-management performance (Belaid-Gater et al., 2023). In addition, the structure of Algerian poultry production is strongly influenced by the availability and cost of feed inputs, many of which are imported (Alloui and Bennoune, 2013). These structural characteristics provide a plausible context for the pronounced variability observed in the Aïn Touta series, although the present dataset does not permit direct attribution of individual price changes to specific supply or cost factors.
Monthly averages ranged from 329.68 DZD in May to 397.66 DZD in December (Table 3). Prices were generally lower during spring and higher during October–December. Monthly CV values ranged from 22.01% in December to 29.67% in January, indicating that relative variability also differed seasonally.
Overall, the descriptive results show that the Aïn Touta egg market was characterised by substantial variation in both price levels and dispersion. The subsequent analyses therefore distinguish between the long-term price trend, seasonal effects and short-term volatility.
Table 1. Overall Descriptive Statistics of Weekly Egg Prices (2013–2025)
| Statistic | Value |
| Number of observations | 624 |
| Mean | 358.60 |
| Median | 360.00 |
| Standard Deviation | 92.79 |
| Minimum | 140.00 |
| Maximum | 620.00 |
| Coefficient of Variation (%) | 25.87 |
Table 2. Annual Descriptive Statistics of Weekly Egg Prices (2013–2025)
| Year | Mean | Median | Standard Deviation | Minimum | Maximum | CV (%) |
| 2013 | 202.18 | 181.00 | 52.25 | 140.00 | 297.50 | 25.84 |
| 2014 | 260.95 | 260.00 | 33.16 | 190.00 | 317.50 | 12.71 |
| 2015 | 395.31 | 400.00 | 25.46 | 350.00 | 440.00 | 6.44 |
| 2016 | 360.59 | 355.00 | 29.66 | 300.00 | 430.00 | 8.23 |
| 2017 | 292.92 | 290.00 | 27.25 | 240.00 | 350.00 | 9.30 |
| 2018 | 318.96 | 320.00 | 43.97 | 240.00 | 420.00 | 13.78 |
| 2019 | 427.92 | 430.00 | 41.20 | 350.00 | 510.00 | 9.63 |
| 2020 | 281.84 | 300.00 | 39.91 | 217.50 | 340.00 | 14.16 |
| 2021 | 382.90 | 400.00 | 47.70 | 242.50 | 450.00 | 12.46 |
| 2022 | 417.65 | 403.75 | 59.66 | 312.50 | 530.00 | 14.28 |
| 2023 | 501.79 | 500.00 | 57.73 | 360.00 | 620.00 | 11.50 |
| 2024 | 417.19 | 410.85 | 64.38 | 320.00 | 560.00 | 15.43 |
| 2025 | 401.58 | 395.00 | 77.08 | 300.00 | 510.00 | 19.20 |
Table 3. Monthly Descriptive Statistics of Weekly Egg Prices (2013–2025)
| Month | Mean | Median | Standard Deviation | Minimum | Maximum | CV (%) |
| January | 349.79 | 360.00 | 103.77 | 140.00 | 560.00 | 29.67 |
| February | 348.30 | 355.00 | 88.36 | 145.00 | 520.00 | 25.37 |
| March | 348.02 | 352.50 | 93.94 | 150.00 | 536.70 | 26.99 |
| April | 333.18 | 335.00 | 88.00 | 145.00 | 470.00 | 26.41 |
| May | 329.68 | 341.65 | 85.66 | 165.00 | 480.00 | 25.98 |
| June | 353.91 | 360.00 | 90.88 | 170.00 | 510.00 | 25.68 |
| July | 354.92 | 365.00 | 79.83 | 190.00 | 500.00 | 22.49 |
| August | 352.89 | 380.00 | 95.07 | 165.00 | 545.00 | 26.94 |
| September | 356.68 | 365.00 | 87.10 | 235.00 | 533.30 | 24.42 |
| October | 382.84 | 400.00 | 90.56 | 240.00 | 580.00 | 23.65 |
| November | 395.30 | 400.00 | 100.77 | 235.00 | 620.00 | 25.49 |
| December | 397.66 | 398.75 | 87.53 | 255.00 | 575.00 | 22.01 |
Note: CV = Coefficient of Variation. Prices are expressed in Algerian dinars (DZD).
3.2. Long-Term Trend and Annual Price Variation
Annual mean egg prices exhibited a significant positive long-term trend (Figure 1). The mean price increased from 202.18 DZD in 2013 to 401.58 DZD in 2025, equivalent to an increase of 98.63%. Linear regression estimated an average increase of 14.93 DZD per year (p = 0.0072; 95% CI: 4.94–24.92 DZD/year), with R² = 0.4961. Thus, approximately half of the interannual variation was associated with the linear time trend, while the remainder reflected non-linear and short-term fluctuations.
The annual trajectory was far from monotonic. The strongest increase occurred in 2015 (+51.49%), whereas the largest decline occurred in 2020 (−34.14%). Prices subsequently increased by 35.86% in 2021 and by a further 20.14% in 2023, before declining in 2024 and 2025 (Figure 2).
This pattern is consistent with the broader evidence that egg-price stability in Algeria is affected by fluctuations in egg production and the technical performance of laying-hen systems. Belaid-Gater et al. (2023) specifically reported that temporal and spatial fluctuations in egg production contribute to instability in Algerian market prices. The poultry sector is also exposed to imported feed inputs, particularly maize and soybean meal, which can transmit changes in input costs to production economics (Alloui and Bennoune, 2013).
Nevertheless, the present results should not be interpreted as evidence that these factors caused the observed annual changes, because production, feed-price and macroeconomic variables were not included in the model. Rather, they provide plausible contextual explanations for why a strong positive long-term trend can coexist with substantial year-to-year reversals.
The significant positive regression slope therefore indicates a persistent increase in the local price level, whereas the relatively moderate R² demonstrates that a simple linear trend is insufficient to describe the complete dynamics of the series.
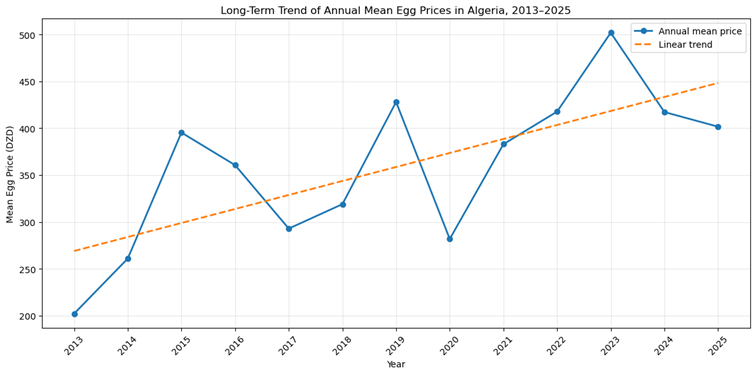
Figure 1. Long-term trend of annual mean egg prices in Algeria, 2013–2025.
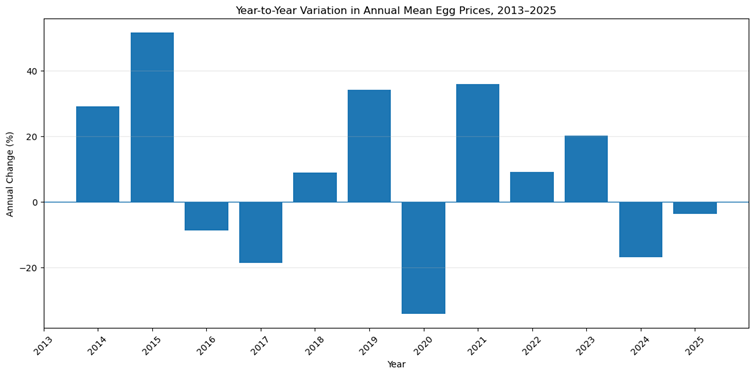
Figure 2. Year-to-year percentage variation in annual mean egg prices in Algeria, 2013–2025.
Table 2. Annual mean price, year-to-year variation, and linear trend of egg prices in Algeria, 2013–2025.
| Year | Mean Price (DZD) | Annual Change (%) | Linear Trend (DZD) |
| 2013 | 202.18 | — | 269.01 |
| 2014 | 260.95 | 29.07 | 283.94 |
| 2015 | 395.31 | 51.49 | 298.87 |
| 2016 | 360.59 | −8.78 | 313.80 |
| 2017 | 292.92 | −18.77 | 328.73 |
| 2018 | 318.96 | 8.89 | 343.67 |
| 2019 | 427.92 | 34.16 | 358.60 |
| 2020 | 281.84 | −34.14 | 373.53 |
| 2021 | 382.90 | 35.86 | 388.46 |
| 2022 | 417.65 | 9.08 | 403.39 |
| 2023 | 501.79 | 20.14 | 418.32 |
| 2024 | 417.19 | −16.86 | 433.26 |
| 2025 | 401.58 | −3.74 | 448.19 |
3.3. Monthly and Seasonal Price Patterns
A pronounced seasonal pattern was observed in monthly egg prices (Figure 3). Mean prices were lowest in May (329.68 DZD) and April (333.18 DZD), while the highest values occurred in December (397.66 DZD), November (395.30 DZD) and October (382.84 DZD). Relative to the overall mean of 358.60 DZD, the seasonal index ranged from 91.94 in May to 110.89 in December (Figure 5).
Thus, May prices were approximately 8.06% below the overall mean, whereas December prices were 10.89% above it. The pattern suggests a recurring shift from comparatively lower spring prices towards higher prices during the final quarter of the year.
The ANOVA confirmed significant differences among months (F = 3.0198, p = 0.000614). Tukey’s HSD test showed that December prices were significantly higher than April (mean difference = 64.48 DZD, p = 0.0174) and May (67.98 DZD, p = 0.0086), while November was significantly higher than April (62.12 DZD, p = 0.0271) and May (65.63 DZD, p = 0.0139). The significant contrasts were therefore concentrated mainly between spring and late autumn/winter.
The seasonal pattern is particularly relevant in the Algerian context because egg prices are influenced by the interaction between production conditions, market supply and demand, and production costs. Previous research on Algerian poultry production has shown that fluctuations in egg output contribute to market instability (Belaid-Gater et al., 2023), while the sector’s dependence on imported feed materials creates exposure to changes in input availability and costs (Alloui and Bennoune, 2013).
However, these studies do not establish the specific causes of the seasonal pattern observed in Aïn Touta. The present results should therefore be interpreted as evidence of seasonality in prices, rather than as direct evidence of a particular biological or economic mechanism.
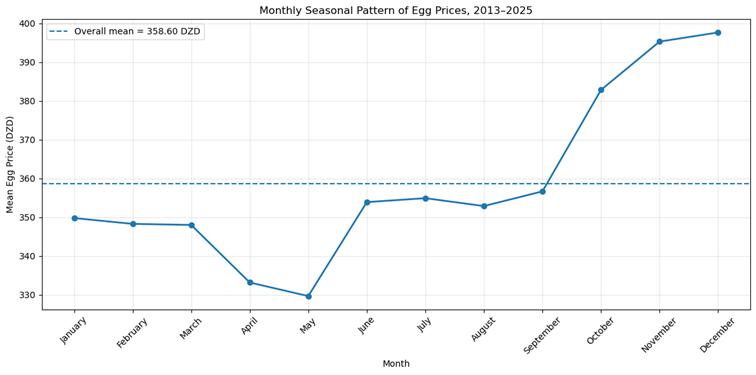
Figure 3. Monthly seasonal pattern of egg prices in Algeria, 2013–2025.
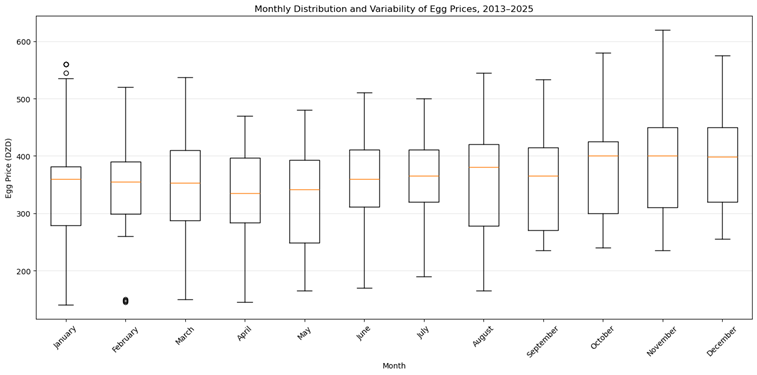
Figure 4. Monthly distribution and variability of egg prices in Algeria, 2013–2025.
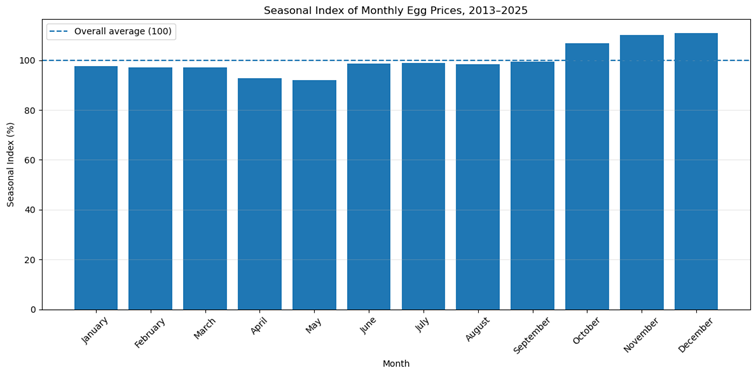
Figure 5. Seasonal index of monthly egg prices in Algeria, 2013–2025.
Table 3. Monthly descriptive statistics and seasonal indices of egg prices in Algeria, 2013–2025.
| Group 1 | Group 2 | Mean Difference (DZD) | Adjusted p-value | 95% CI Lower | 95% CI Upper | Significant |
| April | December | 64.48 | 0.0174 | 5.81 | 123.14 | Yes |
| April | November | 62.12 | 0.0271 | 3.46 | 120.78 | Yes |
| December | May | −67.98 | 0.0086 | −126.64 | −9.32 | Yes |
3.4. Intra-Month Weekly Variability
In contrast to the significant monthly pattern, the position of a week within the month had little influence on average egg prices (Figure 6). Mean prices increased only slightly from 355.86 DZD in Week 1 to 362.26 DZD in Week 4, corresponding to a Week 1–Week 4 difference of 1.80%.
The one-way ANOVA showed no significant differences among the four weekly groups (F = 0.1360, p = 0.9386), and Tukey’s HSD test identified no significant pairwise contrasts. The CV values were also similar, ranging from 25.43% in Week 4 to 26.33% in Week 1.
These findings indicate that the principal temporal structure of the series operates at the monthly and interannual scales, rather than through a systematic Week 1–Week 4 effect. This distinction is important for interpreting the high-frequency dataset: although weekly observations provide greater temporal resolution, simply knowing the week number within a month provides little additional information about the expected price.
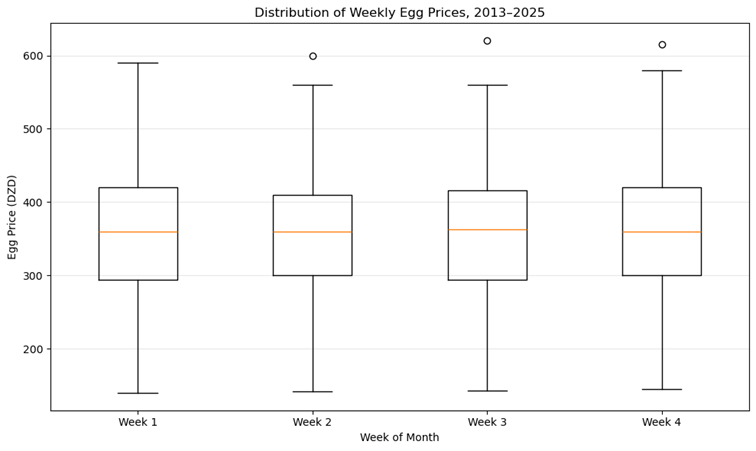
Figure 7. Distribution of weekly egg prices in Algeria, 2013–2025.
Figure 6. Weekly variability of egg prices in Algeria, 2013–2025
3.5. Price Volatility
The volatility analysis revealed substantial short-term instability superimposed on the long-term upward trend. The standard deviation of weekly log returns was 0.0636, corresponding to an average weekly volatility of 6.36%. The mean and median absolute weekly price changes were 3.67% and 2.50%, respectively.
Extreme weekly movements were also observed. The largest positive change was +36.87%, whereas the largest negative change was −46.11%. These values demonstrate that the local market occasionally experienced abrupt price adjustments that cannot be represented adequately by the gradual long-term trend alone.
Volatility varied considerably between years (Figure 10). The highest annual volatility occurred in 2021 (9.90%), followed by 2020 (9.60%), whereas 2016 had the lowest value (2.43%). Notably, the highest volatility did not coincide with the highest annual price level. For example, 2021 had considerably lower average prices than 2023 but substantially greater instability.
The rolling 12-week measure further revealed periods of volatility clustering, with the strongest episode occurring during June–July 2021, when rolling volatility reached approximately 19.4% (Figure 9). Additional periods of elevated volatility were observed around 2013, 2017, 2020–2021 and parts of 2023–2025.
The occurrence of elevated volatility around 2020–2021 is particularly noteworthy because it coincides with a period of strong changes in the annual price series. Similar instability in Algerian egg markets has been linked in previous work to fluctuations in production quantities and farm performance (Belaid-Gater et al., 2023). The importance of feed costs is also well established in Algerian laying-hen production; Belaidi-Gater et al. reported that feed represents more than 60% of production cost in the studied Algerian egg-production system.
These findings suggest that the observed volatility may reflect changes in supply and production conditions, although such mechanisms cannot be tested directly using the price-only dataset. Importantly, the results demonstrate that price level and price volatility are distinct dimensions of market behaviour.
Figure 8. Weekly percentage changes in egg prices in Algeria, 2013–2025.
Figure 9. Rolling 12-week volatility of egg prices in Algeria, 2013–2025.
Figure 10. Annual volatility of egg prices in Algeria, 2013–2025.
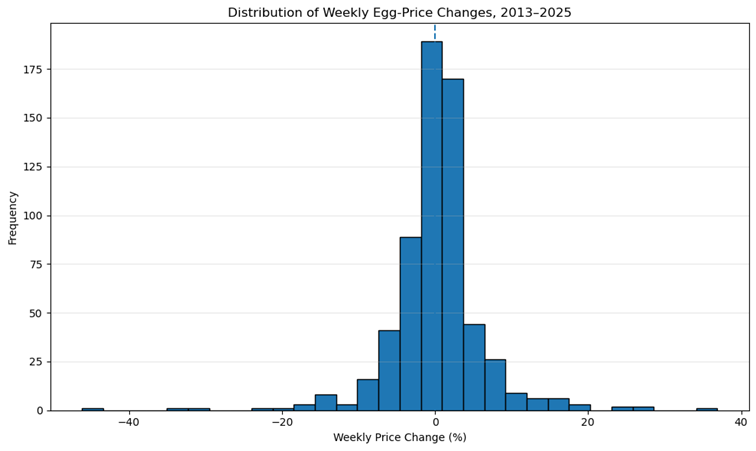
Figure 11. Distribution of weekly egg-price changes in Algeria, 2013–2025.
Table 4. Annual price volatility and weekly price-change statistics for egg prices in Algeria, 2013–2025.
| Rank | Date | Year | Month | Week | Price (DZD) | 12-Week Rolling Volatility |
| 1 | 2021-07-01 | 2021 | July | Week 1 | 390.00 | 0.194437 |
| 2 | 2021-07-08 | 2021 | July | Week 2 | 380.00 | 0.194275 |
| 3 | 2021-07-15 | 2021 | July | Week 3 | 370.00 | 0.194030 |
| 4 | 2021-07-22 | 2021 | July | Week 4 | 360.00 | 0.193701 |
| 5 | 2021-06-22 | 2021 | June | Week 4 | 360.00 | 0.192574 |
| 6 | 2021-06-15 | 2021 | June | Week 3 | 340.00 | 0.191389 |
| 7 | 2021-06-08 | 2021 | June | Week 2 | 320.00 | 0.190319 |
| 8 | 2021-06-01 | 2021 | June | Week 1 | 300.00 | 0.189041 |
| 9 | 2021-05-22 | 2021 | May | Week 4 | 270.00 | 0.184889 |
| 10 | 2021-05-15 | 2021 | May | Week 3 | 260.00 | 0.184493 |
3.6. Forecasting Performance of the ARIMA Model
The forecasting dataset contained 624 weekly observations. The first 499 observations (79.97%) were used for model estimation and the remaining 125 observations (20.03%) were reserved for independent testing. The chronological split prevented future information from entering the training period and therefore provided a more appropriate assessment of predictive performance for a time series.
Among the evaluated specifications, ARIMA(1,1,2) provided the best overall forecasting performance. On the independent testing period, the model produced an MAE of 70.36 DZD, an RMSE of 81.87 DZD and a MAPE of 16.63% (Table 5). The MAPE indicates that forecasts differed from observed prices by approximately 16.6% on average.
The model captured the general level and temporal persistence of the series but responded less effectively to abrupt price changes. For example, on 22 May 2023, the observed price was 477.50 DZD compared with a forecast of 429.79 DZD. On 15 August 2023, the observed value reached 545.00 DZD while the forecast remained substantially lower, producing an absolute error of 117.07 DZD.
This behaviour is consistent with the volatility results. ARIMA models are designed primarily to represent temporal dependence, autoregressive structure and moving-average effects (Box et al., 2015; Hyndman and Athanasopoulos, 2021). They can therefore provide useful baseline forecasts but may have difficulty anticipating sudden shocks when those shocks are not encoded in the historical price structure.
For comparison, the tested SARIMA specification produced a MAPE of 24.89%, compared with 16.63% for ARIMA(1,1,2). The lower testing error of the non-seasonal model suggests that, despite the statistically significant monthly seasonality, explicitly imposing a seasonal structure did not improve weekly out-of-sample forecasting in this dataset. This distinction is important: a statistically significant seasonal pattern does not necessarily imply that a seasonal forecasting model will provide superior predictive accuracy.
Table X. Out-of-sample forecasting performance of ARIMA(1,1,2)
| Model | MAE (DZD) | RMSE (DZD) | MAPE (%) |
| ARIMA(1,1,2) | 70.36 | 81.87 | 16.63 |
3.7. Forecast Validation and Model Diagnostics
Residual diagnostics indicated that the selected ARIMA(1,1,2) model adequately captured the principal serial dependence in the weekly egg-price series. The residuals had a mean of 1.73 DZD and a standard deviation of 21.22 DZD, with values ranging from −204.92 to 140.00 DZD. Although most residuals fluctuated around zero, several relatively large deviations were observed, indicating that the model was less effective during some abrupt price movements (Figure 12).
The autocorrelation function showed that the residual autocorrelations were generally within the 95% confidence limits (Figure 13). This result was confirmed by the Ljung–Box test, which produced p-values of 0.5433, 0.8889 and 0.9769 at lags 10, 20 and 30, respectively (Table 6). Since all p-values exceeded 0.05, there was no evidence of significant residual autocorrelation. Thus, the principal temporal dependence in the price series appears to have been adequately captured by the ARIMA(1,1,2) model.
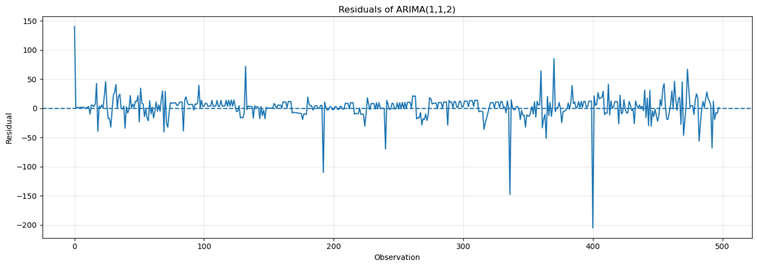
Figure 12. Residual time series of the ARIMA(1,1,2) model for weekly egg prices in Aïn Touta, 2013–2025.
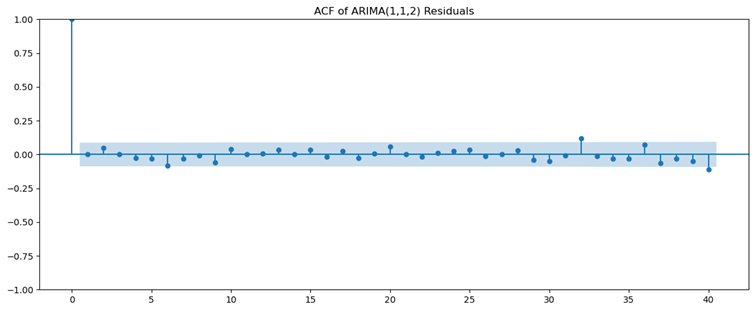
Figure 13. Autocorrelation function of ARIMA(1,1,2) residuals.
Table 6. Ljung–Box test results for ARIMA(1,1,2) residuals
| Lag | Ljung–Box statistic | p-value |
| 10 | 8.8824 | 0.5433 |
| 20 | 12.7235 | 0.8889 |
| 30 | 16.6153 | 0.9769 |
In contrast, the Shapiro–Wilk test indicated a significant departure from normality (W = 0.7431, p < 0.001). The residual distribution also showed a strong concentration around zero with relatively long tails and several extreme observations (Figure 14). This pattern is consistent with the large residuals observed in the time series and suggests that occasional price shocks were not fully represented by the linear ARIMA structure.
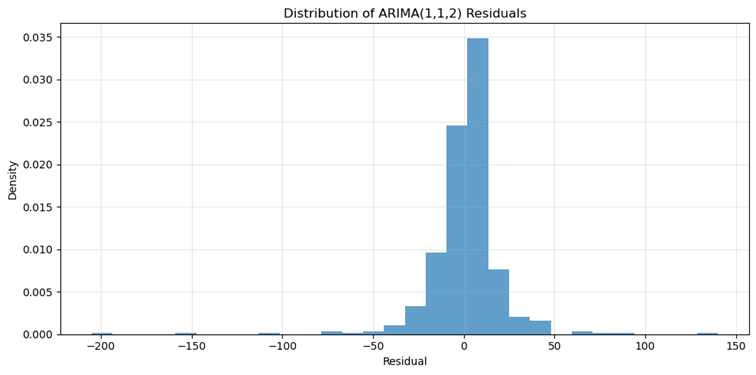
Figure 14. Distribution of ARIMA(1,1,2) residuals for weekly egg prices in Aïn Touta, 2013–2025.
The non-normality of the residuals does not necessarily invalidate the model’s point forecasts. Rather, it indicates that the forecast errors contain occasional extreme observations that are not well described by a Gaussian distribution. This finding is particularly relevant when interpreting prediction intervals, which may be less reliable during periods of unusually rapid price changes.
3.8. Overall Interpretation of Forecasting Results
The results indicate that egg prices in Aïn Touta were characterised by three main features: a significant long-term increase, systematic monthly seasonality, and time-varying short-term volatility. These components describe different dimensions of price behaviour and should therefore be interpreted separately.
The annual mean price increased from 202.18 DZD in 2013 to 401.58 DZD in 2025, corresponding to an overall increase of 98.63%. The significant regression slope confirms that this increase represents more than a random year-to-year fluctuation. Nevertheless, the trajectory was not continuous, with marked reversals in 2015, 2020 and 2021–2023. The coexistence of a positive long-term trend and substantial interannual fluctuations indicates that the local market experienced persistent price growth alongside temporary episodes of adjustment.
A significant seasonal pattern was also identified. Prices were generally lower during spring and higher during the final quarter, with December recording the highest monthly mean and a seasonal index of approximately 110.89. Conversely, the absence of significant differences among Week 1–Week 4 groups indicates that intra-month timing contributed little additional systematic variation. The dominant recurring pattern therefore occurred at the monthly rather than weekly-within-month level.
The volatility analysis provides an additional perspective on these changes. Overall weekly volatility was 6.36%, while individual weekly price changes reached +36.87% and −46.11%. Volatility was particularly elevated during 2020–2021, with rolling 12-week volatility reaching approximately 19.4% in June–July 2021. Importantly, the years with the highest average prices were not necessarily those with the highest volatility, demonstrating that price level and price instability represent distinct characteristics of market behaviour.
The Algerian poultry literature provides relevant sectoral context for these fluctuations. Alloui and Bennoune (2013) reported that the Algerian poultry sector is strongly dependent on imported feed inputs, particularly maize and soybean meal, and identified input-supply difficulties, increasing production costs and commercialisation problems among the major constraints affecting the sector. More recently, Belaid-Gater et al. (2023) reported temporal fluctuations in egg-production quantities and linked market instability partly to variations in production and technical management within the laying sector. These studies provide a plausible economic and production context for the fluctuations observed in the present series, although their effects cannot be quantified here because production and input-price variables were not included in the dataset.
Local market characteristics may also influence observed egg prices. Kara Ali et al. (2014), examining marketed eggs in four eastern Algerian provinces, reported significant differences in egg prices between local and industrial eggs and considered eggs sold through different market channels. This evidence supports the importance of distinguishing local-market price behaviour from national price dynamics. Accordingly, the present results should be interpreted primarily as evidence from Aïn Touta rather than as a direct estimate of egg-price behaviour across Algeria.
The forecasting results further highlight this distinction between predictable and irregular price movements. ARIMA(1,1,2) achieved an MAE of 70.36 DZD, RMSE of 81.87 DZD and MAPE of 16.63% on the independent testing period. The absence of significant residual autocorrelation indicates that the model successfully captured the main temporal dependence in the series. However, the significant non-normality of the residuals and the presence of large forecast errors demonstrate that the model had limited ability to anticipate abrupt price shocks.
Overall, ARIMA(1,1,2) can therefore be considered a useful baseline model for weekly egg-price forecasting, but not a complete representation of the market. Its performance suggests that historical price information contains meaningful predictive structure, while the residual diagnostics indicate that additional variables are required to explain exceptional movements.
Future research should integrate feed prices, egg-production volumes, inflation, transportation costs, climatic conditions, and supply–demand indicators. ARIMAX models could incorporate these external predictors, whereas GARCH-type models could explicitly represent time-varying volatility. Machine-learning and hybrid approaches could also be evaluated to determine whether they improve prediction during periods of abrupt price adjustment.
Conclusion
This study characterised the temporal behaviour of weekly egg prices in Aïn Touta, Batna Province, Algeria, using 624 observations covering 2013–2025. The analysis combined descriptive statistics, trend analysis, seasonal assessment, intra-month comparison, volatility analysis and time-series forecasting to provide a detailed assessment of local egg-price dynamics.
The results revealed a significant long-term increase in egg prices. The annual mean rose from 202.18 DZD in 2013 to 401.58 DZD in 2025, representing an increase of 98.63%, while linear regression estimated a significant annual increase of 14.93 DZD (p = 0.0072). However, the upward trajectory was accompanied by substantial interannual fluctuations, including pronounced changes during 2015, 2020 and 2021–2023. The findings therefore indicate a persistent increase in the local price level combined with temporary market adjustments.
A significant seasonal component was also identified. Prices were generally lower during spring, particularly in May, and higher during October–December. December recorded the highest monthly mean and a seasonal index approximately 10.89% above the overall mean. In contrast, no significant differences were detected among the four weekly positions within a month. This indicates that the principal recurring temporal pattern occurred at the monthly scale rather than within individual months.
The volatility analysis demonstrated substantial short-term instability. Overall weekly volatility was 6.36%, with extreme weekly price changes reaching +36.87% and −46.11%. The strongest concentration of volatility occurred during 2020–2021, when rolling 12-week volatility reached approximately 19.4%. These results demonstrate that periods of high prices do not necessarily coincide with periods of high price instability.
The forecasting analysis showed that ARIMA(1,1,2) provided moderate predictive performance, with an MAE of 70.36 DZD, RMSE of 81.87 DZD and MAPE of 16.63% on the independent testing period. The Ljung–Box tests indicated no significant residual autocorrelation, suggesting that the model captured the principal serial dependence of the series. However, the significant non-normality of the residuals and the occurrence of large forecasting errors indicate that abrupt market shocks remain difficult to predict using historical prices alone.
These findings contribute local, high-frequency evidence to the relatively limited literature on egg-price dynamics in Algeria. Previous Algerian research has largely addressed poultry-sector structure, production performance and characteristics of marketed eggs rather than long-term weekly price behaviour. Alloui and Bennoune (2013) highlighted the structural constraints affecting Algerian poultry production, including dependence on imported feed inputs and commercialisation difficulties, while Belaid-Gater et al. (2023) documented fluctuations in the performance and production of the laying sector. Kara Ali et al. (2014) further demonstrated differences in prices between local and industrial eggs in eastern Algerian markets. The present study extends this literature by examining a continuous weekly price series over 13 years at the local-market level.
Because the analysis relied exclusively on historical prices, causal conclusions about the determinants of price movements cannot be drawn. Future studies should combine price data with feed costs, production volumes, inflation, transportation costs, climatic conditions and supply–demand indicators. Multivariate and volatility-sensitive approaches, including ARIMAX, GARCH, machine-learning and hybrid models, may improve forecasting performance, particularly during periods of abrupt price adjustment.
In conclusion, egg prices in Aïn Touta were characterised by the combined presence of long-term price growth, significant seasonality and episodic short-term volatility. The ARIMA(1,1,2) model provides a useful baseline for forecasting, while the observed non-Gaussian shocks highlight the need for models incorporating additional economic and production information.
References
- Alloui, N., & Bennoune, O. (2013). Poultry production in Algeria: Current situation and future prospects. World’s Poultry Science Journal, 69(3), 613–620. https://doi.org/10.1017/S0043933913000615.
- Belaid-Gater, N., Kadi, S. A., Mouhous, A., Tahir, L., & Hamadache, M. (2019). Feed efficiency of laying hens in an industrial egg production farm in Algeria. In Proceedings of the 13th Journées de la Recherche Avicole et Palmipèdes à Foie Gras, Tours, France, 20–21 March 2019, pp. 535–537.
- Belaid-Gater, N., Mouhous, A., Saidj, D., & Kadi, S. A. (2023). Production performances of the poultry-laying sector in Algeria: Data analysis of an table eggs production complex. Revue Agrobiologia, 13(1), 3333–3341.
- FAO. (2003). Egg marketing: A guide for the production and sale of eggs. Food and Agriculture Organization of the United Nations.
- Kaci, A. (2022). La filière avicole en Algérie: Acquis, contraintes et enjeux. 14èmes Journées de la Recherche Avicole et Palmipèdes à Foie Gras.
- Pandian, A. S. S., Kumar, G. S., Prabu, M., Selvakumar, K. N., & Saraswathi, S. (2011). Time series analysis of wholesale and retail egg prices in major market centres of South India. Indian Journal of Animal Research, 45(1), 38–42.
- Pradheeshwaran, U., Ganesamoorthy, S. K., et al. (2025). Time series analysis of egg prices in various market centres of India. International Journal of Agriculture Extension and Social Development, 8(1), 210–215. https://doi.org/10.33545/26180723.2025.v8.i1d.1530.
- Box, G. E. P., Jenkins, G. M., Reinsel, G. C., & Ljung, G. M. (2015). Time Series Analysis: Forecasting and Control (5th ed.). Wiley. This is the classical reference for Box–Jenkins/ARIMA methodology.
- Hyndman, R. J., & Athanasopoulos, G. (2021). Forecasting: Principles and Practice (3rd ed.). OTexts. This provides methodological guidance on ARIMA modelling, training/test sets, forecasting, and residual diagnostics.
- Dickey, D. A., & Fuller, W. A. (1979). Distribution of the estimators for autoregressive time series with a unit root. Journal of the American Statistical Association, 74(366a),
- 427–431. https://doi.org/10.1080/01621459.1979.10482531.Ljung, G. M., & Box, G. E. P. (1978). On a measure of lack of fit in time series models. Biometrika, 65(2), 297–303. The Ljung–Box test is specifically designed to assess remaining autocorrelation in time-series residuals.
- Hyndman, R. J., & Koehler, A. B. (2006). Another look at measures of forecast accuracy. International Journal of Forecasting, 22(4), 679–688. https://doi.org/10.1016/j.ijforecast.2006.03.001
- Box, G.E.P., Jenkins, G.M., Reinsel, G.C., Ljung, G.M. 2015. Time series analysis: Forecasting and control. 5th ed. Wiley, Hoboken, NJ.
- Dickey, D.A., Fuller, W.A. 1979. Distribution of the estimators for autoregressive time series with a unit root. Journal of the American Statistical Association, 74, 427–431.
- Hyndman, R.J., Athanasopoulos, G. 2021. Forecasting: Principles and practice. 3rd ed. OTexts, Melbourne.
- Alloui N, Bennoune O. 2013. Poultry production in Algeria: current situation and future prospects. World’s Poultry Science Journal 69(3): 613–620. https://doi.org/10.1017/S0043933913000615.
- Belaid-Gater N, Mouhous A, Saidj D, Kadi SA. 2023. Production performances of the poultry-laying sector in Algeria: data analysis of an table eggs production complex. Revue Agrobiologia 13(1): 3333–3341.
- Kara Ali M, Ait Kaki A, Milet A, Moula N. 2014. Quality assessment of marketed eggs in Eastern Algeria. Nature & Technologie 6(2): 52–58.