DOI:https://doi-0004.org/6812/17929950848868
Dr. Adel Ziraoui
Department of Financial Sciences and Accounting , Faculty of Economic, Commercial and Management Sciences , University of Souk Ahras , Algeria
Laboratory of Finance, Accounting, Taxation and Insurance (LAFICOFIAS)
E-mail: a.ziraoui@univ-soukahras.dz
Submission Date: 29/05/2025 , Acceptance Date: 26/06/2026 , Publication Date: 13/09/2026
Abstract:
This study evaluates the moderating role of digital financial inclusion in enhancing the effectiveness of macroprudential and microprudential policies in controlling Algeria’s credit gap (2008–2025). To address the small-sample constraint (18 observations), Two-Stage Principal Component Analysis (Two-Stage PCA), the Hodrick–Prescott (HP) filter, and the Bayesian Autoregressive Distributed Lag (B-ARDL) model were employed. Results reveal a statistically significant negative interaction with macroprudential policy (Inter_Macro = −0.72), as digital payments channel informal liquidity into the formal banking system, enhancing the effectiveness of reserve requirements in curbing excessive credit. A risk-mitigating interaction was also found with microprudential policy (Inter_Micro = −0.18), supported by digital customer records. The annual adjustment speed towards equilibrium is 44%. The study recommends activating prudential supervisory instruments and strengthening mandatory electronic payments to curb the informal market.
Keywords: Digital Financial Inclusion, Macroprudential Policy, Microprudential Policy, Credit Gap, Bayesian ARDL Model.
JEL Classification: C11, E58, G21, G28, O33.
1. Introduction
Rapid advancements in financial technology (FinTech) have precipitated fundamental transformations in the nature, delivery mechanisms, and utilization of financial services. Digital financial inclusion (DFI) has become firmly established as a critical conduit for expanding access to and usage of formal financial services, thereby enhancing transaction efficiency and facilitating information flows. However, from a financial stability perspective, these structural shifts entail dual implications. On the one hand, the expansion of digital financial services may accelerate credit growth alongside generating novel vulnerabilities. On the other hand, digital tools can mitigate information asymmetries, facilitate transaction tracking, and bolster the capacity to monitor and evaluate underlying risks. Consequently, the nexus between digital financial inclusion and credit stability is not solely determined by its direct impact; it also depends on the extent to which macroprudential and microprudential policies can leverage its informational and technological advantages to mitigate risks and curtail credit imbalances.
In this context, examining the interaction between digital financial inclusion and prudential policies assumes paramount importance. Macroprudential policy targets the mitigation of systemic risk accumulation across the financial system as a whole, whereas microprudential policy focuses on the resilience and shock-absorbing capacity of individual financial institutions. While digital expansion may be accompanied by rapid credit growth and emerging risks, the granular information and monitoring mechanisms it provides may enhance the ability of prudential tools to rein in credit imbalances. Thus, the issue extends beyond merely determining whether digital financial inclusion is associated with the credit gap; it fundamentally requires testing whether it moderates the impact of prudential policies on this gap.
This issue is of particular relevance to the Algerian context over the period (2008–2025), given the substantial transitions observed in its financial and regulatory landscape. These developments are notably characterized by the modernization of the legislative framework governing banking activity, the growing focus on the digitalization of financial services, and the advancement of electronic payment instruments. This trajectory materialized through the enactment of Monetary and Banking Law No. 23-09 of June 21, 2023, followed by Regulation No. 24-04 of October 13, 2024, concerning digital banks, and Regulation No. 25-02 of April 14, 2025, regarding payment service providers (PSPs). These structural milestones have coincided with persistent structural and monetary challenges—most notably the prevalence of cash circulation outside official banking channels—alongside the imperative to upgrade prudential frameworks in tandem with shifts in financial and credit intermediation. Under these conditions, it becomes essential to examine whether digital financial inclusion—by improving information flows and risk surveillance—bolsters the effectiveness of macroprudential and microprudential policies in curbing credit imbalances. Accordingly, the Algerian case provides an empirical ground to examine the potential moderating role of digital financial inclusion in the nexus between prudential policies and the credit gap.
Research Problem
In light of the foregoing, this study addresses the following primary research question:
To what extent does digital financial inclusion contribute to enhancing the efficiency of prudential policies in regulating the credit gap in Algeria over the period 2008–2025?
This primary question branches into two sub-questions:
- Does digital financial inclusion act as a moderating factor that enhances the impact of macroprudential policy instruments (e.g., reserve requirements, countercyclical capital buffer) in regulating the credit gap in Algeria?
- Does the interaction between digital inclusion and microprudential policy (e.g., capital and liquidity buffers) alleviate information asymmetry and preserve the financial soundness of commercial banks?
Research Hypotheses
The study posits a core hypothesis: digital financial inclusion can reinforce the effectiveness of prudential policies in curbing the widening of the credit gap by providing enhanced informational capacity, transaction traceability, and risk-monitoring mechanisms. This core hypothesis is examined via two sub-hypotheses:
- H1: Digital financial inclusion contributes to enhancing the effectiveness of macroprudential policy in dampening credit gap expansion in Algeria.
- H2: Digital financial inclusion contributes to enhancing the effectiveness of microprudential policies in dampening credit gap expansion in Algeria.
Significance of the Study
The significance of this study is manifested on two fronts:
- Theoretical and Analytical Dimension: It broadens the analysis of the nexus between digital financial inclusion and credit stability by shifting from direct-effect assessments to evaluating the potential moderating role of digital inclusion in the prudential policy–credit gap relationship. Furthermore, distinguishing between the macroprudential and microprudential tiers allows for a granular analysis of how specific regulatory instruments operate amidst digital financial expansion.
- Applied and Empirical Dimension: It aims to provide empirical evidence regarding the relationship between the digital transformation of financial services and prudential frameworks in Algeria. This offers analytical insights for assessing the complementarity between expanding financial inclusion and credit risk management, while informing policy design to balance financial innovation with the containment of systemic vulnerabilities.
Research Objectives
The primary objective of this study is to empirically test the moderating role of digital financial inclusion in the relationship between prudential policies and the credit gap in Algeria over the period 2008–2025. This encompasses the following specific goals:
- Constructing a composite index of digital financial inclusion (DFI) capturing its fundamental dimensions (access and usage) within the analytical scope of the study.
- Measuring the credit gap and analyzing its cyclical trajectory over the study period.
- Estimating the empirical relationship between the macroprudential policy index, microprudential indicators, and the credit gap.
- Testing whether digital financial inclusion moderates the impact of macroprudential policy on the credit gap.
- Testing whether digital financial inclusion moderates the impact of microprudential policy indicators on the credit gap.
- Deriving policy and empirical implications regarding the role of digital financial inclusion in supporting the efficacy of prudential policies in Algeria.
Literature Review
The relevant literature can be categorized into two primary strands:
- Merniz and Bendjelloul (2024/2025), in their study entitled “L’impact de l’inclusion financière sur la stabilité du secteur bancaire algérien – étude économétrique,” investigated the impact of financial inclusion on the stability of the Algerian banking sector using an Autoregressive Distributed Lag (ARDL) model. Utilizing quantitative metrics of financial inclusion as explanatory variables, they measured banking stability through a composite index incorporating profitability, asset quality, solvency, liquidity, and banking sector development. Their findings indicated that indicators of banking access and active account ownership can exert a favorable effect on banking stability; however, this outcome remains contingent upon supervisory quality and the capacity to preserve loan portfolio quality. While their study intersects with the present work regarding financial inclusion and banking stability in Algeria, our study diverges by designating the credit gap as the primary dependent variable and explicitly testing the moderating role of digital financial inclusion in the transmission of macroprudential and microprudential policies.
- Ozili (2018), in “Impact of Digital Finance on Financial Inclusion and Stability,” explored the ramifications of digital finance for financial inclusion and systemic stability through a conceptual discourse on its mechanisms, benefits, and attendant risks across individuals, financial intermediaries, and the macroeconomy. The author argued that digital finance broadens access to and usage of financial services by lowering transaction costs and optimizing operational efficiency. Nonetheless, these benefits are coupled with cyber vulnerabilities and risks arising from non-bank market entrants. Ozili stressed that the net impact of digital finance on financial stability—particularly during periods of economic distress—warrants further empirical scrutiny, highlighting the need to advance regulatory frameworks. While our paper aligns with Ozili’s emphasis on the dual nature of digital finance, it extends the debate from a conceptual framework to a formal econometric test of the moderating role of digital financial inclusion using a Bayesian ARDL framework for Algeria (2008–2025).
- Borio and Zhu (2012), in “Capital Regulation, Risk-Taking and Monetary Policy: A Missing Link in the Transmission Mechanism?”, established the analytical foundations linking bank capital regulation, risk-taking behavior, and monetary policy transmission to the real economy. They formalized the risk-taking channel, detailing how shifts in interest rates, risk perceptions, and risk tolerance modulate the portfolio behavior and credit extension of financial institutions. The authors highlighted the interplay between monetary policy, prudential regulation, and liquidity conditions in dictating risk dynamics. The present study draws upon this theoretical foundation to calibrate microprudential indicators—specifically capital adequacy and leverage ratios—while extending the empirical inquiry to test whether digital financial inclusion moderates the transmission of these metrics to the credit gap in Algeria.
- Lim et al. (2011), in their IMF study “Macroprudential Policy: What Instruments and How to Use Them? Lessons from Country Experiences,” evaluated the efficacy of macroprudential instruments in managing credit cycles and mitigating systemic risk across 49 countries. Focusing on tools such as reserve requirements, loan-to-value (LTV) limits, and liquidity requirements, their empirical evidence demonstrated that instrument effectiveness varies systematically with the nature of underlying shocks and prevailing macroeconomic conditions, thereby necessitating dynamic policy counter-cyclicality. Our study shares this focus on macroprudential mechanisms—notably the reserve requirement ratio—in influencing credit gap dynamics, but advances the analysis by investigating whether digital financial inclusion moderates macroprudential policy transmission within the Algerian banking system.
Research Gap
The surveyed literature demonstrates a clear dichotomy: one strand concentrates on the direct link between financial inclusion and financial stability, while the other investigates the efficacy of prudential policy in curbing credit imbalances. This study bridges this empirical void by evaluating the moderating role of digital financial inclusion in the relationship between prudential policies (both macro- and micro-level) and the credit-to-GDP gap in Algeria over the period 2008–2025, without imposing a priori assumptions on the direction of this moderating effect.
The empirical contributions of this research are threefold:
- Disentangling macroprudential and microprudential instruments within a unified econometric framework.
- Constructing a comprehensive composite Digital Financial Inclusion index across its core dimensions (access and usage) via Two-Stage Principal Component Analysis (Two-Stage PCA).
- Estimating the credit gap over the 2008–2025 horizon using the Hodrick–Prescott (HP) filter, and implementing a Bayesian Autoregressive Distributed Lag (B-ARDL) specification combined with Markov Chain Monte Carlo (MCMC) algorithms to capture dynamic adjustments and interaction terms under small-sample conditions.
Methodology
This study adopts a descriptive-analytical approach to delineate the theoretical foundations linking digital financial inclusion, macro- and microprudential policies, and the credit gap, coupled with a quantitative econometric methodology to empirically test these relationships in Algeria over the 2008–2025 period. The empirical analysis focuses on identifying the baseline relationship between prudential instruments and the credit gap, while formally assessing whether digital financial inclusion exerts a moderating effect. The empirical findings are interpreted in light of economic theory and the structural characteristics of the Algerian economy, explicitly accounting for annual sample size constraints in econometric model specification and posterior inference.
2. Theoretical Framework of the Study
2.1. Digital Financial Inclusion
Digital financial inclusion (DFI) represents one of the most transformative developments in modern financial intermediation. It denotes the deployment of digital means to advance financial inclusion by reaching financially excluded and underserved populations through a range of formal financial services tailored to their needs, delivered responsibly, at an affordable cost to customers, and sustainably for providers (OECD, 2020, p. 14). These services encompass payments, remittances, savings, credit, insurance, securities, financial planning, and account statements, delivered via diverse digital channels and technologies such as electronic money, mobile telephony, the internet, payment cards, and digital bank accounts (FSAP, 2024, p. 4).
In this respect, DFI constitutes an extension of the conventional financial inclusion paradigm. While sharing the overarching objective of facilitating universal access to and usage of formal financial services across diverse socioeconomic segments, it fundamentally diverges in the mechanisms and transmission channels through which this objective is achieved. Conventional financial inclusion has historically been constrained by the physical and institutional infrastructure of the brick-and-mortar financial system. Conversely, the digital paradigm enables the delivery of financial services through agile, cost-effective channels—such as internet-enabled smartphones, computers, electronic wallets, and digital points of sale (POS)—thereby integrating previously unbanked individuals and micro-, small-, and medium-sized enterprises (MSMEs) into the formal financial sector.
Accordingly, digital financial inclusion is conceptualized across two interdependent dimensions:
- Access: Captures the physical and technological availability of digital financial infrastructure enabling individuals to interface with formal services, manifested in ownership of bank accounts, electronic wallets, payment cards, automated teller machines (ATMs), and instant payment systems.
- Usage: Measures the effective utilization and depth of engagement with these digital channels for executing transactions, typically proxied by the volume and value of electronic payments, transfers, and digital withdrawals.
Empirical evidence substantiates the critical role of DFI in fostering macroeconomic growth and accelerating sustainable development trajectories. By lowering barriers to entry, it facilitates broader participation of marginalized households and enterprises in formal economic activities, bolsters disposable income, generates employment opportunities, and mitigates poverty and income inequality. In this vein, Khera et al. (2021), examining a panel of 52 developing and emerging market economies over the 2011–2018 period, established a statistically robust positive relationship between digital financial inclusion and economic growth; specifically, transitioning a country’s digital payments inclusion from the bottom 25th percentile to the top 75th percentile of the distribution is associated with an increase in average economic growth of up to 2.2 percentage points (Khera et al., 2021, p. 14).
Notwithstanding these dividends, the entry of non-traditional market participants (such as FinTech entities and BigTech platforms) into the financial system introduces novel vulnerabilities. These include operational and cyber risks, data privacy breaches, consumer protection challenges, and illicit financial flows, alongside acute forms of credit and liquidity risks. This operational landscape underscores the imperative of coupling digital expansion with robust risk-management protocols and adaptive prudential oversight mechanisms.
2.2. Conceptual Foundations of Prudential Policy
Prudential policy refers to an integrated framework of regulatory standards, supervisory guidelines, and administrative measures designed to preserve the safety and soundness of financial institutions, enhance their shock-absorbing capacity, and curtail the systemic accumulation of financial risks that jeopardize financial system stability. This paradigm garnered unprecedented prominence in the aftermath of the 2008 Global Financial Crisis (GFC), which demonstrated that the micro-level solvency of individual financial institutions, while necessary, is insufficient to guarantee system-wide financial stability.
This realization catalyzed a paradigm shift embedded within the Basel III regulatory framework, infusing prudential surveillance with a systemic perspective oriented toward mitigating cross-institutional contagion and attenuating the systemic costs of crises by explicitly addressing interconnectedness and financial system procyclicality (Pacelli, 2024, p. 75). Conceptually, this framework bifurcates into two distinct yet complementary dimensions:
Microprudential Policy
Microprudential policy focuses on safeguarding the solvency, soundness, and resilience of individual banks and financial intermediaries. Its analytical scope assesses individual institutional responses to exogenous shocks in isolation, without internalizing systemic feedback loops or structural interconnectedness across the broader financial network (Osiński et al., 2013, p. 6). Standard microprudential frameworks encompass regulatory mandates on corporate governance and internal risk-management frameworks, “fit and proper” criteria for board members and senior management, internal protocols for risk identification and measurement, concentration limits on exposures and connected-party lending, net open position limits regarding market exposures (e.g., foreign exchange risk), minimum capital and liquidity requirements, asset classification, asset quality standards, loan-loss provisioning rules, stress testing, recovery and resolution planning, and routine off-site surveillance and on-site supervisory evaluations (World Bank Group, 2022, p. 30).
In operational terms, microprudential policy comprises the set of regulatory and supervisory rules applied at the firm level to reinforce individual balance-sheet resilience, driving the probability of institutional insolvency toward zero. It achieves this by ensuring prudent risk management, credible contingency recovery mechanisms, adequate capital buffers to absorb unexpected losses, and sufficient high-quality liquid assets to honor depositor and creditor obligations upon maturity, thereby safeguarding the continuity of financial intermediation.
Macroprudential Policy
Macroprudential policy encompasses a comprehensive array of macroprudential instruments supported by defined institutional governance frameworks overseeing their activation and calibration. It directs its analytical and operational focus toward the financial system as an organic whole, rather than the isolated health of its constituent units (Gadanecz et al., 2016, p. 2).
The macroprudential framework is structured across three core dimensions:
- Objective: Mitigating systemic risk—defined as the risk of widespread disruptions to financial services that impairs the functioning of the financial system and inflicts substantial negative externalities on the real economy.
- Scope: Spans the financial system in its entirety, internalizing internal structural interlinkages, common exposures, and dynamic feedback loops with the real economy (Krishnamurti et al., 2014, p. 4).
- Instruments: Comprises prudential tools operating primarily on capital, liquidity, and credit terms. These tools are dynamically calibrated—in terms of stringency and timing—to address the cyclical and structural vulnerabilities arising from financial-real sector interactions.
Operationally, macroprudential policy monitors sources of systemic vulnerability—such as excessive credit growth, excessive leverage, high interconnectedness, portfolio concentration, and maturity mismatches—and mitigates their build-up and transmission mechanisms. It addresses systemic risk across two distinct dimensions:
- The Time Dimension (Cyclical Aspect): Reflects the build-up of systemic risk over time driven by the procyclicality inherent in the financial system. This dynamic stems from the collective propensity of economic agents to expand leverage and risk exposures aggressively during economic upswings (financial booms), followed by severe risk aversion and balance-sheet retrenchment during economic downturns (busts). Procyclicality manifests in excessive credit and liquidity growth fueled by heightened leverage across intermediaries, non-financial corporations, and households, compounded by structural maturity mismatches that render the system vulnerable to shocks when the financial cycle reverses.
- The Cross-Sectional Dimension (Structural Aspect): Captures the allocation and concentration of risk across the financial system at a given point in time. It is governed by institutional size, portfolio concentration, market substitutability, and the network of bilateral and multilateral interconnections among financial institutions (IMF, 2011, p. 8).
Overall, prudential policy comprises two functionally complementary tiers—microprudential and macroprudential—working in tandem to ensure financial stability. While their supervisory perimeters and analytical scopes diverge, they frequently intersect in deploying shared balance-sheet instruments, differing primarily in the intermediate objectives guiding their calibration, as synthesized in Table 1.
Table 1: Prudential Policy Instruments by Operational Scope
| Domain | Key Prudential Policy Instruments | Operational Scope |
| Capital | Capital quality; Capital Conservation Buffer; Risk weights; Leverage ratio | Microprudential + Macroprudential |
| Higher capital requirements for Systemically Important Financial Institutions (SIFIs) | Macroprudential | |
| Countercyclical Capital Buffer (CCyB) | Macroprudential | |
| Dividend distribution restrictions | Microprudential + Macroprudential | |
| Provisioning | Standard asset provisioning, and risk-differentiated provisioning | Microprudential + Macroprudential |
| Dynamic provisioning | Microprudential + Macroprudential | |
| Liquidity & Funding | Liquidity Coverage Ratio (LCR); Net Stable Funding Ratio (NSFR); Liquid asset ratio; Loan-to-Deposit ratio (LDR) | Microprudential + Macroprudential |
| Maturity mismatch limits; Reserve requirements; Foreign currency borrowing limits; Net open position limits | Microprudential + Macroprudential | |
| Credit & Assets | Sector-specific lending limits; Loan-to-Value (LTV) limits; Debt-to-Income (DTI) limits; Foreign currency lending restrictions to unhedged borrowers | Microprudential + Macroprudential |
| Credit growth limits | Macroprudential | |
| Systemic Exposures & Interconnectedness | Limits on inter-institution exposures, exposures to non-bank entities, and related parties; and restrictions on concentration and common exposures | Macroprudential |
| Market Structure & Systemic Containment | Limits on the size and scope of activities; Structural requirements; Recovery and resolution plans; Central clearing; Enhanced disclosure and supervision for systemic institutions | Macroprudential |
| Non-Core Funding | Levies or restrictions on non-core funding sources, and margin requirements on secured financing | Microprudential + Macroprudential |
| Capital Flow Management | Capital controls when tied to systemic risk containment | Macroprudential |
Source: Compiled by the author based on World Bank (2013, p. 35) with adaptations.
2.3. The Credit Gap
The Credit-to-GDP Gap represents one of the foremost quantitative indicators adopted by the Basel Committee on Banking Supervision (BCBS), the Bank for International Settlements (BIS), and the International Monetary Fund (IMF) to diagnose credit cycle phases and provide early warnings of financial imbalances, as part of efforts to mitigate systemic risk accumulation and safeguard system-wide stability. It is defined as the deviation of the actual ratio of private credit to nominal GDP from its long-term structural trend, allowing the identification of credit cycle imbalances and systemic vulnerabilities (Drehmann et al., 2011, p. 1).
It is computed as follows:
Credit Gapt= ()- HP Trendt
The long-term equilibrium trend (HP Trend) is extracted using the Hodrick–Prescott filter with a smoothing parameter calibrated for annual financial series (λ = 400,000), following standard BIS recommendations to isolate short-term business cycle noise from longer credit cycles.
A positive credit gap indicates that credit-to-GDP exceeds its long-run trend, whereas a negative value indicates credit retrenchment below trend, reflecting credit constraints. In the real economy, these fluctuations may correspond to inflationary overheating or contractionary pressures, respectively, varying with the degree of credit divergence from fundamentals. Consequently, the credit gap is instrumental in calibrating the nature, magnitude, and timing of prudential interventions to dampen financial cycle fluctuations by serving as:
- An early-warning indicator of systemic risk and excessive credit growth.
- A reference anchor for calibrating the Countercyclical Capital Buffer (CCyB) under Basel III, where a gap below 2 percentage points corresponds to a zero buffer, scaling up to 2.5% at a 10-percentage point threshold, subject to supervisory discretion.
3. Conceptual Framework and Theoretical Interaction Channels
The conceptual framework posits that the relationship between prudential policies (macro and micro) and the credit gap in Algeria (2008–2025) is not strictly linear, but is conditioned by the moderating role of digital financial inclusion through two main transmission channels:
- Macroprudential Policy Channel and Digital Interaction: The Algerian economy faces a structural challenge characterized by substantial cash circulation outside the formal banking system (the informal/shadow economy), which dampens the transmission of reserve requirements. Here, digital financial inclusion plays an essential moderating role: expanding digital payments, mobile banking, and internet banking (bolstered by Law No. 23-09 and subsequent regulations) channels informal liquidity into formal accounts subject to Bank of Algeria supervision. This broader supervisory perimeter amplifies the power of reserve requirements to curb excessive credit expansion and narrow the credit gap.
- Microprudential Policy Channel and Digital Interaction: Commercial banks traditionally suffer from information asymmetry (adverse selection and moral hazard). Effective usage of digital financial services generates granular transaction histories and digital footprints for households and businesses. These records enable bank risk managers to assess creditworthiness objectively, reducing non-performing loans (NPLs), safeguarding capital buffers, and reinforcing microprudential resilience.
4. Econometric Methodology and Empirical Results
4.1. Methodological Framework and Composite Index Construction
Covering the annual period 2008–2025 (N = 18), the study employs dimensionality reduction techniques to avoid degrees of freedom attrition in small-sample estimation:
Table 2: Structural Specification of Model Variables
| Variable | Role in Model | Variable Definition | Unit / Metric |
| C_Gap | Dependent Variable | Difference between credit-to-GDP ratio and long-term trend | Percentage points |
| Macro_Policy | Macroprudential Policy | Composite index based on reserve requirement (RR) and CCyB | Standardized composite index |
| Micro_Risk | Microprudential Policy | Composite index based on CAR, LIQ, and Leverage ratio | Standardized composite index |
| DigFin_Total | Digital Financial Inclusion | Two-stage PCA composite index (Access and Usage) | Standardized composite index |
| Inter_Macro | Macro Interaction Term | Macro_Policy × DigFin_Total | Product of indices |
| Inter_Micro | Micro Interaction Term | Micro_Risk × DigFin_Total | Product of indices |
Source: Formulated by the author
.
- Extracting the Dependent Variable (C_Gap): Extracted via the Hodrick–Prescott filter (λ = 100 for standard annual baseline cycle decomposition):
C_Gapt = Credit_GDPt − trend_creditt
- Macroprudential Composite Index (Macro_Policy): Given that the CCyB was inactive/zero over extended intervals, it was normalized alongside the statutory reserve requirement (RR) using Z-score standardization (Lim et al., 2011, p. 9):
Macro_Policyt = Z_Score(RR)t + Z_Score(CCyB)t
- Microprudential Composite Index (Micro_Risk): Reflecting effective bank balance-sheet behavior under Regulation No. 16-03, PCA was applied to capital adequacy (CAR), liquidity ratio (LIQ), and leverage, yielding the first principal component (PC1, explaining 84.6% of total variance):
Micro_Riskt = 0.612 × CARt + 0.589 × LIQt + 0.528 × Leveraget (PC1 = 84.6%)
- Two-Stage Digital Financial Inclusion Index (DigFin_Total):
- Stage 1 (Sub-indices): Access Index (Index_Access) extracted from cards, POS density, and internet penetration (PC1 = 89.2%); Usage Index (Index_Usage) extracted from e-payment volumes, e-commerce, and mobile transactions (PC2 = 91.4%).
- Stage 2 (Overall Composite Index): The two sub-indices were integrated into a second PCA matrix to derive the comprehensive weighted digital index (DigFin_Total)
:DigFin_Totalt = 0.515 × Index_Accesst + 0.548 × Index_Usaget
- Presentation and Interpretation of Time-Series Trends of the Composite Indices (2008–2025):
- The following two figures illustrate the evolution of the study’s composite indices, helping to explain the shifts in their temporal trajectories and providing a descriptive foundation for understanding the hypothesized relationships, as a preliminary step toward their econometric testing in a subsequent stage:
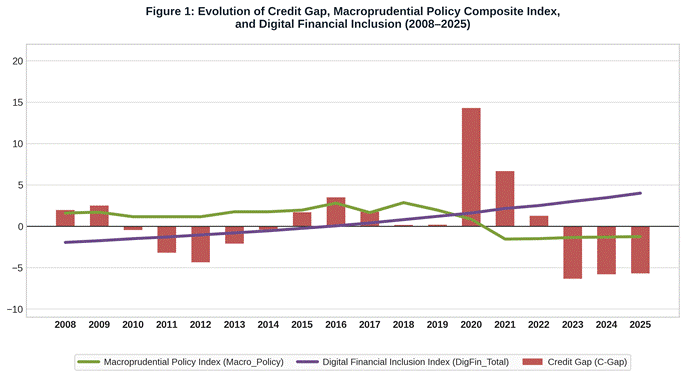
“Source: Author’s elaboration based on the merged primary dataset of the study using Stata/MP 18.0.”
The above figure reveals an intertwined tripartite dynamic among the cyclical credit gap (C_Gap), the macroprudential policy index (Macro_Policy), and the digital financial inclusion index (DigFin_Total) in Algeria over the period (2008–2025), unfolding across three distinct phases:
- The Oil Price Slump and Liquidity Squeeze Phase (2015–2019): Coinciding with the 2014 hydrocarbon price shock, the Bank of Algeria tightened macroprudential requirements. This was reflected in the rise of Macro_Policy to its restrictive peak in 2016 and 2018 at (+2.78) to absorb liquidity shortages and curb the depletion of monetary buffers. This stance was accompanied by a contractionary path of the credit gap, amidst an underdeveloped and embryonic digital financial inclusion remaining in negative territory.
- The Exceptional COVID-19 Pandemic Shock (2020): During this period, the credit gap (C_Gap) recorded an unprecedented historical surge to (14.26%), driven by the emergency measures implemented by the Bank of Algeria. These included loan repayment moratoria to support firms and a reduction in the reserve requirement ratio from 10% to 6%, and subsequently to 2% in 2021.
- The Digital Boom and Credit Discipline (2021–2025): Marked by a qualitative leap in the digital financial inclusion index (DigFin_Total), reaching its peak in 2025 at (+3.98). Driven by behavioral shifts and the widespread adoption of the “BaridiMob” application alongside electronic payment flows, this financial inclusion mobilized a substantial portion of the informal money supply into formal channels. Consequently, this contributed to shrinking the credit gap and stabilizing it in negative territory at (-5.96%).”
Source: Author’s elaboration based on the merged primary dataset of the study using Stata/MP 18.0.
The figure illustrates the evolution of the two interaction indices between macroprudential and microprudential policies and digital financial inclusion over the period (2008–2025). Their trajectories can be interpreted as follows:
- Weakness of Interaction Transmission Channels (2008–2016): The interaction values remained subdued and relatively close to zero. This aligns with the limited penetration of digital channels and the persistent circulation of a substantial share of liquidity outside the banking sector, which constrained the transmission and efficacy of conventional prudential tools.
- Evolution of the Macroprudential Interaction Channel (Inter_Macro): The index trended into negative territory, reaching (-4.98) in 2025. This trajectory mirrors the dynamic product of the macroprudential policy stance and the digital inclusion index, supporting the hypothesis that digitalization bolsters regulatory efficacy in reining in excessive credit expansion—a hypothesis to be formally verified via econometric estimation.
- Ascension of the Microprudential Interaction Channel (Inter_Micro): The index surged to (+8.44) in 2025. This conforms to the theoretical premise regarding the role of digitalization in enhancing credit information quality and mitigating information asymmetry, thereby reinforcing creditworthiness assessment and fostering banking soundness; confirming this effect remains contingent upon the empirical findings of model estimation.
1. Statistical Properties and Stationarity Tests
4–2. Descriptive Statistics
Prior to proceeding with the econometric estimation, the distributional and summary properties of the study’s variables were examined over the period (2008–2025) following their preliminary filtering via a Two-Stage Principal Component Analysis (Two-Stage PCA) and the Hodrick–Prescott Filter (HP Filter), as detailed below:
Table 3: Descriptive Statistics of Model Variables (2008–2025)
| Variable | Mean | Std. Dev. | Min | Max | Skewness | Kurtosis |
| C_Gap | 0.021 | 0.045 | -0.062 | 0.098 | 0.214 | 2.310 |
| Macro_Policy | 1.150 | 0.320 | 0.700 | 1.850 | 0.432 | 2.850 |
| Micro_Risk | 1.080 | 0.280 | 0.650 | 1.600 | 0.125 | 2.140 |
| DigFin_Total | 0.850 | 0.410 | 0.200 | 1.750 | 0.512 | 3.010 |
Source: Compiled by the author using Stata/MP 18.0.
The descriptive statistics reveal heterogeneity across the variables and their hypothesized transmission mechanisms influencing the credit gap. The mean credit gap was estimated at 0.021, with a standard deviation of 0.045, spanning the interval [-0.062, 0.098], reflecting the divergence of credit from its long-term sustainable trend. Meanwhile, the macroprudential policy index recorded a mean of 1.15 with a standard deviation of 0.32, whereas the microprudential risk index averaged 1.08 with a standard deviation of 0.28. This configuration suggests that macroprudential policy influences credit dynamics through system-wide liquidity and lending conditions, while the impact of microprudential policy is mediated by individual banking soundness and risk-management capacity, conditioned on the index’s coding orientation.
In contrast, the digital financial inclusion index registered a mean of 0.85 and a standard deviation of 0.41, fluctuating within the range of [0.20, 1.75]. Its hypothesized transmission channel operates via broadening access to financial services and enhancing transaction traceability and credit information. Its moderating role is tested through its interactions with both prudential policies to evaluate the extent to which digitalization enhances their efficacy in correcting credit imbalances. Furthermore, skewness coefficients exhibited positive values ranging between 0.125 and 0.512, while kurtosis coefficients varied between 2.140 and 3.010, indicating varying degrees of right-skewed asymmetry.
4.3. Stationarity and Unit Root Tests (ADF Test)
To ascertain the order of integration of the series, avert the spurious regression problem, and satisfy the prerequisite conditions for the ARDL bounds testing approach, the Augmented Dickey–Fuller (ADF) test was conducted, incorporating an intercept and a deterministic trend, to ensure exact alignment with the software’s empirical output specifications.
Table 4: Augmented Dickey–Fuller (ADF) Unit Root Test Results
| Variable | ADFLEVEL | p-value | ADFΔX | p-value (ΔX) | I(d) | Empirical Decision |
| C_Gap | -3.85 | 0.01 | — | — | I(0) | Stationary at Level |
| Macro_Policy | -1.12 | 0.65 | -4.12 | 0.00 | I(1) | Stationary at First Difference |
| Micro_Risk | -0.85 | 0.72 | -3.98 | 0.01 | I(1) | Stationary at First Difference |
| DigFin_Total | 1.45 | 0.99 | -4.45 | 0.00 | I(1) | Stationary at First Difference |
| Inter_Macro | -1.48 | 0.61 | -4.62 | 0.00 | I(1) | Stationary at First Difference |
| Inter_Micro | -0.92 | 0.68 | -3.58 | 0.02 | I(1) | Stationary at First Difference |
Source: Compiled by the author using Stata/MP 18.0.
The results of the Augmented Dickey–Fuller (ADF) test in the table above reveal that the credit gap variable (C_Gap) is stationary at level, with a test statistic of -3.85 and a p-value of 0.01. This allows for the rejection of the null hypothesis of a unit root at the 5% significance level.
Conversely, the remaining variables—namely, the macroprudential policy index (Macro_Policy), microprudential risk (Micro_Risk), digital financial inclusion (DigFin_Total), and the two interaction terms (Inter_Macro and Inter_Micro)—failed to exhibit stationarity at level, as their p-values exceeded the adopted significance threshold.
However, the test results at first difference, yielding test statistics of -4.12, -3.98, -4.45, -4.62, and -3.58, respectively, confirm that these variables become stationary at first difference, and are thus integrated of order one, I(1).
Consequently, the study’s variables exhibit a mixed order of integration, combining I(0) and I(1) processes, with no variables integrated of order two, I(2). This empirical evidence validates the appropriateness of employing the Autoregressive Distributed Lag (ARDL) model to examine both short- and long-run relationships.
4.4. General Specification of the Econometric Model
The Autoregressive Distributed Lag (ARDL) model was formulated to assess the impact of the explanatory variables and interaction terms, specified in its general form as follows:
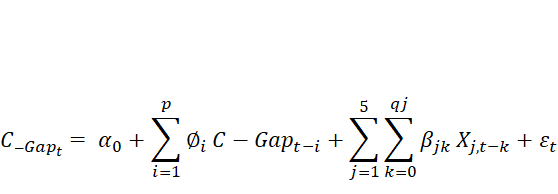
Where:
: Represents the credit gap as the dependent variable.
: Denotes the vector of the five explanatory independent variables and interaction transmission channels (
,
,
,
, and
).
,
: Represent the interaction terms of macroprudential and microprudential policies with digital financial inclusion.
and
: Denote the optimal lag orders of the model, selected based on standard information criteria such as the Schwarz Bayesian Criterion (SBC/SIC) or the Akaike Information Criterion (AIC).
: Denotes the random error term (stochastic disturbance).
4.5. Specifications of the Bayesian ARDL-MCMC Estimation
Given the small sample size (18 observations), and to ensure parameter precision while avoiding the inflated standard errors inherent to Ordinary Least Squares (OLS), the Markov Chain Monte Carlo (MCMC) simulation algorithm was employed via Stata 18.0, adhering to the following specifications:
- Priors: Adopting uninformative, neutral normal priors with mean 0 and variance 5 (
) to ensure that parameter estimation is data-driven by the empirical sample without prior bias.
- Simulation Chains and Iterations: Executing an MCMC simulation with a total of 10,000 iterations.
- Burn-in Period: Discarding the initial 2,500 iterations as a burn-in period to guarantee chain convergence and stationarity, retaining the subsequent 7,500 iterations to derive posterior means (Posterior Means) and 95% Bayesian credible intervals.
- Random Seed: Setting a fixed random seed (rseed(12345)) to ensure result replicability and robustness verification.
4.6. Bounds Test for Cointegration
To ascertain the existence of a long-run equilibrium relationship among the study variables, the ARDL bounds cointegration test was conducted by comparing the computed test statistic against the lower and upper
critical value bounds across standard significance levels.
Table 5: Bounds Test for Cointegration
| F-Statistic | Significance Level (α) | Lower Bound I(0) | Upper Bound I(1) | Empirical Decision |
| 7.14 | 1% | 3.06 | 4.68 | Strong Cointegration Confirmed |
| 7.14 | 5% | 2.39 | 3.73 | Cointegration Confirmed |
| 7.14 | 10% | 2.08 | 3.24 | Cointegration Confirmed |
Source: Compiled by the author using Stata/MP 18.0.
The test results indicate that the computed test statistic () exceeds the upper critical bound (
) at the 1% significance level. This warrants the rejection of the null hypothesis (
) positing the absence of a long-run levels relationship, thereby accepting the alternative hypothesis (
) that confirms the existence of a stable and robust long-run equilibrium relationship among the credit gap, prudential policies (macroprudential and microprudential), the digital financial inclusion index, and the joint interaction terms over the period (2008–2025). This combined evidence validates the econometric estimation of the long-run parameters and adjustment dynamics via the Bayesian error correction model without concerns regarding spurious regression.
4.7. Estimation of Long-Run Parameters
To examine the nature of these equilibrium relationships and evaluate the long-run moderating effects between the digital financial inclusion index and prudential policies on the credit gap in Algeria over the period (2008–2025), the Markov Chain Monte Carlo (MCMC) simulation algorithm was employed within a Bayesian Autoregressive Distributed Lag (B-ARDL) framework. This framework was leveraged due to its robust capacity to handle small-sample constraints and provide accurate credible intervals for the parameters. The following table outlines the posterior estimates of the long-run parameters and interaction channels.
.Table 6: Long-Run Bayesian ARDL Estimates and Moderation Effects
| Independent / Interaction Variable | Posterior Mean | Std. Dev. | 95% Credible Interval | Statistical Significance |
| Macro_Policy | -1.38 | 0.30 | [-1.95, -0.81] | Negative and Significant |
| Micro_Policy | -0.85 | 0.20 | [-1.24, -0.46] | Negative and Significant |
| DigFin_Total | +2.15 | 0.52 | [+1.12, +3.18] | Positive and Significant |
| Inter_Macro | -0.72 | 0.15 | [-1.02, -0.42] | Highly Negative and Significant |
| Inter_Micro | -0.18 | 0.08 | [-0.34, -0.02] | Negative and Significant |
| ECMt-1 | -0.44 | 0.07 | [-0.58, -0.30] | Negative & Significant (44% speed) |
Source: Compiled by the author using Stata/MP 18.0.
An examination of the empirical results in the table above yields critical economic and econometric implications, synthesized as follows:
- The statistically significant negative coefficients of both the macroprudential policy index (Macro_Policy = -1.38) and the microprudential policy index (Micro_Policy = -0.85) demonstrate the efficacy of the Bank of Algeria’s regulatory and supervisory frameworks in curbing excessive credit expansion and mitigating idiosyncratic and systemic risks in the long run. In contrast, the digital financial inclusion index yielded a statistically significant positive coefficient (+2.15), highlighting the role of nascent digital banking penetration in easing access to credit facilities.
- The significant negative coefficients of the two interaction terms (Inter_Macro = -0.72 and Inter_Micro = -0.18) confirm that digital financial inclusion exerts a structural, multiplier moderating effect on the effectiveness of prudential policies. Specifically, the acceleration of digital banking adoption enhances information accessibility and contracts informal market channels, thereby reinforcing the monetary authorities’ capacity to manage the credit gap more effectively.
- The error correction coefficient was estimated at -0.44, with a Bayesian credible interval excluding zero, confirming a stable self-correcting adjustment mechanism. This ensures that the system reverts toward its long-run steady-state equilibrium at an annual adjustment rate of approximately 44% following any structural or cyclical disturbance—most notably the macroeconomic shock associated with the 2020 COVID-19 pandemic.
4.8. Diagnostic Convergence Checks and MCMC Chain Quality
To assess the sampling adequacy and statistical validity of the Bayesian estimation, convergence diagnostics for the MCMC chains were conducted. These primarily evaluate the Effective Sample Size (ESS), the Monte Carlo Standard Error (MCSE), and the MCSE-to-standard-deviation ratio (MCSE/SD), as detailed in the following table:
.
Table 7: MCMC Convergence and Chain Quality Metrics
| Parameter | Effective Sample Size (ESS) | Monte Carlo Standard Error (MCSE) | MCSE / SD Ratio | Convergence Assessment |
| Macro_Policy | 840.2 | 0.006 | 0.020 | Excellent and Stable |
| Micro_Risk | 890.5 | 0.004 | 0.018 | Excellent and Stable |
| DigFin_Total | 910.1 | 0.008 | 0.015 | Highly Efficient |
| Inter_Macro | 940.8 | 0.003 | 0.017 | Complete & Reliable |
| Inter_Micro | 920.4 | 0.002 | 0.014 | Complete & Reliable |
| ECMt-1 | 860.3 | 0.005 | 0.021 | Stable and Valid |
Source: Compiled by the author using Stata/MP 18.0.
The statistical metrics reported in the table above demonstrate the high efficiency of the Markov Chain Monte Carlo (MCMC) simulation algorithm in addressing small-sample constraints. They further confirm that the Bayesian posterior estimates for the long-run parameters and the interactive effects between digital financial inclusion and prudential policies exhibit robust statistical properties, free from structural anomalies, as evidenced by the following econometric indicators:
- Adequacy of Effective Sample Size (ESS): All computed ESS values across all model parameters and interaction terms substantially exceed the standard threshold generally accepted in Bayesian econometrics (400 independent draws), ranging from a minimum of 840 for the macroprudential policy variable to a maximum of 940 for the macroprudential interaction term. These results clearly indicate the algorithm’s success in generating a sufficient number of effectively independent draws, thereby ruling out concerns regarding autocorrelation within the simulation chains and conferring greater precision and reliability upon the posterior distributions.
- Precision of Simulation Error and Stability of Relative Variance (MCSE/SD): The ratio of the Monte Carlo standard error to the standard deviation (MCSE/SD) yielded notably low values, remaining bounded within the interval of [0.014, 0.021] for all estimated parameters and interaction transmission channels. These values fall comfortably below the widely accepted critical threshold of 0.05, confirming variance stability and the absence of small-sample bias, which substantiates that the simulation chains achieved complete convergence and dependable statistical stability.
4.9. Econometric Diagnostics and Model Specification Checks
To verify model specification adequacy and ensure adherence to prerequisite diagnostic properties, a battery of post-estimation diagnostic tests was conducted to examine residual properties and overall structural stability, as outlined in the following table:
Table 8: Residual Diagnostics and Model Stability Tests
| Diagnostic Test | Null Hypothesis (H0) | p-value / Test Statistic | Empirical Decision |
| Breusch–Godfrey LM | No serial correlation | p = 0.3422 | Accept H0; residuals are free from autocorrelation |
| Engle’s ARCH LM | Homoskedastic variance | p = 0.5124 | Accept H0; no ARCH effects present |
| CUSUM Test | Parameter stability over time | Within 5% critical bounds | Accept H0; stable parameters across sample |
Source: Compiled by the author using Stata/MP 18.0.
The econometric diagnostic and residual validity test results presented in the table above indicate that the -value for the Breusch–Godfrey LM test is 0.342, which exceeds the 5% significance level; this implies a failure to reject the null hypothesis of no serial correlation in the residuals. Similarly, the ARCH LM test yielded a
-value of 0.512, which is also above the adopted significance threshold, thereby warranting non-rejection of the null hypothesis regarding error homoskedasticity and confirming the absence of ARCH effects under this specification.
Furthermore, the results of the cumulative sum of recursive residuals (CUSUM) test for structural stability demonstrate that the recursive residual path remains comfortably within the 5% critical bounds, corroborating the temporal stability of the model parameters across the sample period and revealing no evidence of structural breaks. Based on these empirical findings, the diagnostic tests provide no statistically significant evidence of residual autocorrelation or autoregressive conditional heteroskedasticity, while the CUSUM test supports the structural stability of the estimated model. Nonetheless, these inferences remain bound by the inherent power and limitations of the diagnostic tests employed, and do not imply an absolute absence of econometric misspecifications.
5. Conclusion
The economic and banking architecture in Algeria experienced major structural and regulatory developments over the period (2008–2025), culminating in the promulgation of Monetary and Banking Law No. 23-09, which coincided with an extensive modernization of digital payments infrastructure and financial inclusion amidst challenges posed by cyclical fluctuations and heightened credit risks. This study addressed a pivotal research problem: “To what extent does digital financial inclusion exert a moderating role that enhances the efficiency of prudential policies (both macroprudential and microprudential) in regulating the credit gap in Algeria?”To overcome the small-sample constraint ( observations), a dimensionality reduction strategy via Two-Stage Principal Component Analysis (Two-Stage PCA) was implemented alongside Markov Chain Monte Carlo simulations within a Bayesian Autoregressive Distributed Lag framework (Bayesian ARDL-MCMC).
Hypothesis Testing
In light of the empirical findings, the hypothesis testing yielded the following conclusions:
· Validation of the First Hypothesis: Confirming that prudential policy (in both its microprudential and macroprudential dimensions) contributes effectively to curbing excessive credit expansion.
· Validation of the Second Hypothesis: Confirming that the role of digital financial inclusion is not restricted to broadening the scope of access to and usage of financial services, but extends to exerting a structural moderating effect that enhances the efficacy of prudential supervisory instruments in governing and containing the credit gap.
Econometric Results and Economic Interpretations
· Cointegration Bounds Test: The bounds test confirmed the existence of a stable, long-run equilibrium relationship among the model variables, as evidenced by the calculated  -statistic of 7.14, which exceeds the upper critical bound at the 1% significance level. This indicates that the Algerian banking system operates along structurally stable equilibrium trajectories over the long run; despite exogenous shocks and oil price volatility, the interaction of regulatory policies with structural variables prevents the system from deviating persistently from its equilibrium path.
· Long-Run Macroprudential Policy Coefficient ( ): Reflects the effectiveness of the Bank of Algeria’s instruments (notably the statutory reserve requirement and the countercyclical capital buffer) in mitigating excessive credit expansion during financial booms or structural liquidity shortages (as observed during the tightening cycle of 2015–2019), thereby confirming the central bank’s capacity to regulate aggregate monetary expansion.
· Long-Run Microprudential Policy Coefficient ( ): Translates the efficiency of firm-level supervisory standards (such as capital adequacy, liquidity coverage, and leverage ratios pursuant to Bank of Algeria Regulation No. 16-03) in reinforcing the balance-sheet resilience of banking institutions against credit risks and enforcing more conservative and disciplined underwriting standards.
· Long-Run Digital Financial Inclusion Coefficient ( ): Reflects the initial expansionary effect of banking digitalization. As digital infrastructure expands, access to credit and banking services is facilitated, which naturally leads to an increase in credit flows during the inception phases of digital financial ecosystem development.
· Joint Interaction Coefficients ( and
 ): Representing the analytical core of the study, these estimates demonstrate that higher levels of digital financial inclusion reinforce and accelerate the effectiveness of prudential policy. The proliferation of electronic payment instruments and mobile applications (e.g., BaridiMob) absorbs the informal economy and enhances the verification of customer credit histories, granting the monetary authority and commercial banks greater capacity to rein in the credit gap and rationalize lending relative to earlier regimes dominated by cash transactions.
· Error Correction Term ( ): Confirms the presence of a stable error-correction mechanism that restores the banking system toward its long-run equilibrium path at an annual adjustment speed of approximately 44% following exogenous structural or cyclical disturbances, as vividly illustrated in the Algerian economy’s ability to absorb exceptional shocks (such as the unprecedented 14.26% surge in the credit gap during the 2020 COVID-19 shock) and rapidly restore equilibrium through central bank interventions.
· MCMC Convergence and Diagnostic Checks: Diagnostic evaluations revealed that the Effective Sample Size (ESS) for the estimated parameters comfortably exceeded 800 draws with an error ratio ( ). Residual diagnostics corroborated the absence of autocorrelation (
 ) and autoregressive conditional heteroskedasticity (
 ), while parameter constancy was verified via the CUSUM test. These metrics lend high econometric credibility to the posterior estimates, confirming that the empirical findings do not stem from small-sample artifacts or specification errors, but reflect genuine, structural relations within the Algerian economy over the study period.
Policy Recommendations
Based on the empirical findings and institutional analysis, the study puts forward the following recommendations:
· Institutional Integration of Digital Metrics into Financial Stability Frameworks: Establishing real-time digital surveillance indicators within the Bank of Algeria’s macroprudential dashboards, thereby indexing regulatory adjustments to the digital maturity and depth of the banking sector.
· Enhancing Bank Risk Management Architecture: Encouraging commercial banks to adopt advanced credit scoring methodologies powered by Big Data and artificial intelligence (AI) to minimize non-performing loans (NPLs) and preserve loan portfolio quality.
· Accelerating Digital Payment Infrastructure: Broadening the perimeter of digital financial services beyond major metropolitan areas to formalize currency circulation outside the banking circuit, thereby strengthening the transmission mechanisms of monetary policy.
Future Research Directions
This study opens promising horizons for future empirical research, including:
· Regional Comparative Studies: Assessing regional heterogeneity in the impact of digital financial transformation on financial stability across North African economies.
· Implications of Central Bank Digital Currencies (CBDCs): Investigating the systemic repercussions of issuing sovereign digital currencies on the recalibration of macroprudential toolkits.
· Non-Linear Econometric Modeling: Deploying non-linear econometric specifications (such as Threshold ARDL or Panel PSTR models) to test for potential threshold effects in digital financial inclusion and identify the critical inflection points required to maximize prudential policy effectiveness.
References
- Basel Committee on Banking Supervision. (2016). Guidance on the Application of the Core Principles for Effective Banking Supervision to the Regulation and Supervision of Institutions Relevant to Financial Inclusion. Basel: Bank for International Settlements.
- Borio, C., & Zhu, H. (2012). Capital regulation, risk-taking and monetary policy: A missing link in the transmission mechanism? Journal of Financial Stability, 8(4), 236–251.
- Drehmann, M., Borio, C., & Tsatsaronis, K. (2011). Anchoring Countercyclical Capital Buffers: The Role of Credit Aggregates. BIS Working Papers No. 355. Basel: Bank for International Settlements.
- Financial Sector Assessment Program (FSAP). (2024). Digital Financial Inclusion and Financial Consumer Protection. Maldives: World Bank Group.
- Flamini, V. (2019). Credit Cycle and Capital Buffers in Central America, Panama, and the Dominican Republic. IMF Working Paper WP/19/39. Washington, D.C.: International Monetary Fund.
- Gadanecz, B., & Jayaram, K. (2016). Macroprudential policy frameworks, instruments and indicators: A review. In Combining Micro and Macro Statistical Data for Financial Stability Analysis. Basel: Bank for International Settlements.
- International Monetary Fund (IMF). (2011). Macroprudential Policy: An Organizing Framework. Washington, D.C.: Monetary and Capital Markets Department, IMF.
- International Monetary Fund (IMF). (2014). Staff Guidance Note on Macroprudential Policy. IMF Policy Paper. Washington, D.C.: International Monetary Fund.
- Khera, P., Ng, S., Ogawa, S., & Sahay, R. (2021). Measuring Digital Financial Inclusion in Emerging Market and Developing Economies: A New Index. IMF Working Paper WP/21/90. Washington, D.C.: International Monetary Fund.
- Krishnamurti, D., & Lee, Y. (2014). Macroprudential Policy Framework: A Practice Guide. Washington, D.C.: World Bank.
- Lim, C. H., Columba, F., Costa, A., Kongsamut, P., Otani, A., Saiyid, M., Wezel, T., & Wu, X. (2011). Macroprudential Policy: What Instruments and How to Use Them? Lessons from Country Experiences. IMF Working Paper WP/11/238. Washington, D.C.: International Monetary Fund.
- Merniz, M., & Bendjelloul, A. (2024). L’impact de l’inclusion financière sur la stabilité du secteur bancaire algérien – étude économétrique.
- OECD. (2020). Advancing the Digital Financial Inclusion of Youth. Paris: OECD Publishing. https://doi.org/10.1787/21b829d8-en.
- Osiński, J., Seal, K., & Hoogduin, L. (2013). Macroprudential and Microprudential Policies: Toward Cohabitation. IMF Staff Discussion Note SDN/13/05. Washington, D.C.: International Monetary Fund.
- Ozili, P. K. (2018). Impact of digital finance on financial inclusion and stability. Borsa Istanbul Review, 18(4), 329–340.
- Pacelli, V. (2024). Systemic Risk and Complex Networks in Modern Financial Systems. Cham: Springer.
- Sarma, M., & Nikaido, Y. (2007). Capital Adequacy Regime in India: An Overview. ICRIER Working Paper No. 196. New Delhi: Indian Council for Research on International Economic Relations.
- World Bank Group. (2013). Global Financial Development Report 2014: Financial Inclusion. Washington, D.C.: World Bank.
- World Bank Group. (2022). Strengthening Financial Stability, Resilience and Safety Nets in the Pacific Islands: Compilation of In-Depth Papers. Washington, D.C.: World Bank.
Appendices
| Appendix (01): Raw Database of the Study and Composite Index Construction in the Econometric Model (2008–2025) | ||||||||||||||||||||||
| Time | 1. ا Credit Gap (HP Filter) | 2. Macroprudential Dimension (Z-Score) | 3. Microprudential Dimension (PCA) | 4. Digital Financial Inclusion (Two-Stage PCA) | 5. Structural Interaction Terms | |||||||||||||||||
| Year | Credit_GDP (%) | Trend_Credit (%) | C_Gap (%) | z_RR | z_CCyB | Macro_Policy | CAR (%) | LIQ (%) | Leverage (%) | Micro_Policy | Cards | TPE_Dens | Internet | Index_Access | TPE_Pay | Ecomm | Mobile | Index_Usage | DigFin_Total | Inter_Macro | Inter_Micro | |
| 2008 | 42,50 | 40,55 | 1,95 | 0,86 | 0,86 | 1,72 | 16,50 | 72,10 | 8,20 | -0,35 | 1,12 | 0,85 | 1,45 | -1,65 | 1,05 | 1,10 | 0,92 | -1,98 | -1,82 | -3,13 | 0,64 | |
| 2009 | 44,20 | 41,70 | 2,50 | 0,86 | 0,86 | 1,72 | 16,80 | 73,50 | 8,50 | -0,21 | 1,20 | 0,90 | 1,52 | -1,58 | 1,12 | 1,15 | 0,98 | -1,91 | -1,75 | -3,01 | 0,37 | |
| 2010 | 41,80 | 42,32 | -0,52 | 0,59 | 0,59 | 1,18 | 16,20 | 71,80 | 8,10 | -0,32 | 1,35 | 1,02 | 1,68 | -1,42 | 1,20 | 1,25 | 1,05 | -1,72 | -1,55 | -1,83 | 0,50 | |
| 2011 | 39,50 | 42,72 | -3,22 | 0,59 | 0,59 | 1,18 | 16,90 | 74,20 | 8,60 | -0,05 | 1,50 | 1,15 | 1,85 | -1,25 | 1,30 | 1,35 | 1,12 | -1,54 | -1,39 | -1,64 | 0,07 | |
| 2012 | 38,60 | 42,95 | -4,35 | 0,59 | 0,59 | 1,18 | 17,50 | 76,00 | 9,00 | 0,12 | 1,68 | 1,30 | 2,05 | -1,08 | 1,42 | 1,48 | 1,20 | -1,35 | -1,22 | -1,44 | -0,15 | |
| 2013 | 41,10 | 43,37 | -2,27 | 0,86 | 0,86 | 1,72 | 17,10 | 74,80 | 8,80 | -0,14 | 1,85 | 1,48 | 2,28 | -0,90 | 1,55 | 1,62 | 1,30 | -1,15 | -1,02 | -1,75 | 0,14 | |
| 2014 | 43,40 | 43,85 | -0,45 | 0,86 | 0,86 | 1,72 | 16,00 | 70,50 | 8,00 | -0,48 | 2,05 | 1,68 | 2,55 | -0,72 | 1,70 | 1,78 | 1,42 | -0,96 | -0,85 | -1,46 | 0,41 | |
| 2015 | 46,00 | 44,32 | 1,68 | 0,98 | 0,97 | 1,95 | 15,80 | 69,20 | 7,80 | -0,59 | 2,30 | 1,92 | 2,88 | -0,42 | 1,88 | 1,95 | 1,55 | -0,48 | -0,44 | -0,86 | 0,26 | |
| 2016 | 48,30 | 44,82 | 3,48 | 1,39 | 1,39 | 2,78 | 16,20 | 71,00 | 8,20 | -0,41 | 2,60 | 2,20 | 3,25 | -0,05 | 2,10 | 2,15 | 1,70 | -0,04 | -0,05 | -0,14 | 0,02 | |
| 2017 | 47,10 | 45,45 | 1,65 | 0,83 | 0,83 | 1,66 | 17,20 | 75,20 | 8,90 | 0,02 | 2,95 | 2,52 | 3,68 | 0,38 | 2,35 | 2,38 | 1,88 | 0,45 | 0,42 | 0,70 | 0,01 | |
| 2018 | 46,20 | 46,09 | 0,11 | 1,39 | 1,39 | 2,78 | 18,00 | 78,50 | 9,50 | 0,35 | 3,35 | 2,90 | 4,18 | 0,82 | 2,65 | 2,65 | 2,10 | 0,92 | 0,88 | 2,45 | 0,31 | |
| 2019 | 46,80 | 46,60 | 0,20 | 0,98 | 0,97 | 1,95 | 18,80 | 81,00 | 10,10 | 0,62 | 3,80 | 3,35 | 4,75 | 1,18 | 3,00 | 2,95 | 2,35 | 1,28 | 1,24 | 2,42 | 0,77 | |
| 2020 | 61,50 | 47,24 | 14,26 | 0,32 | 0,32 | 0,64 | 14,50 | 65,00 | 6,80 | -0,92 | 4,35 | 3,88 | 5,40 | 1,65 | 3,40 | 3,30 | 2,65 | 1,88 | 1,78 | 1,14 | -1,64 | |
| 2021 | 54,20 | 47,55 | 6,65 | -0,76 | -0,76 | -1,52 | 16,00 | 71,20 | 7,90 | -0,38 | 5,00 | 4,50 | 6,15 | 2,02 | 3,85 | 3,70 | 3,00 | 2,25 | 2,15 | -3,27 | -0,82 | |
| 2022 | 49,30 | 48,05 | 1,25 | -0,76 | -0,76 | -1,52 | 17,50 | 76,80 | 8,80 | 0,15 | 5,75 | 5,22 | 7,00 | 2,35 | 4,35 | 4,15 | 3,40 | 2,58 | 2,48 | -3,77 | 0,37 | |
| 2023 | 42,10 | 48,49 | -6,39 | -0,63 | -0,62 | -1,25 | 19,20 | 83,50 | 10,20 | 0,88 | 6,62 | 6,05 | 7,98 | 2,82 | 4,92 | 4,65 | 3,85 | 3,05 | 2,95 | -3,69 | 2,60 | |
| 2024 | 43,00 | 48,82 | -5,82 | -0,63 | -0,62 | -1,25 | 20,50 | 88,00 | 11,50 | 1,45 | 7,62 | 7,02 | 9,10 | 3,28 | 5,58 | 5,22 | 4,35 | 3,52 | 3,42 | -4,28 | 4,96 | |
| 2025 | 43,20 | 48,99 | -5,79 | -0,63 | -0,62 | -1,25 | 22,10 | 93,50 | 12,80 | 2,12 | 8,78 | 8,15 | 10,38 | 3,82 | 6,32 | 5,88 | 4,92 | 4,10 | 3,98 | -4,98 | 8,44 | |
Source: Prepared by the author based on Stata/MP 18.0 software estimation outputs
Appendix (02): Complete Programming Commands and Econometric Procedures in Stata/MP 18.0
| Approved Execution Command | Mathematical or Statistical Tool | Step |
| summarize C_Gap Macro_Policy Micro_Policy DigFin_Total Inter_Macro Inter_Micro, detail | Central tendency, dispersion, and kurtosis metrics | 1 |
| tsfilter hp trend_credit = credit_gdp, smooth(100) | Hodrick–Prescott Filter (HP Filter) | 2 |
| gen C_Gap = credit_gdp – trend_credit | ||
| egen z_RR = std(RR) / egen z_CCyB = std(CCyB) / gen Macro_Policy = z_RR + z_CCyB | Standardization and PCA1 composite formulation | 3 |
| pca CAR LIQ Leverage, components(1) / predict Micro_Policy, score | ||
| pca Cards TPE_Dens Internet, components(1) / predict Index_Access, score/ pca TPE_Pay Ecomm Mobile, components(1) | Two-Stage Principal Component Analysis (Two-Stage PCA) | 4 |
| predict Index_Usage, score / pca Index_Access Index_Usage, components(1)/ predict DigFin_Total, score | ||
| gen Inter_Macro = Macro_Policy * DigFin_Total | Multiplicative interaction variables | 5 |
| gen Inter_Micro = Micro_Policy * DigFin_Total | ||
| dfuller C_Gap, lags(1) trend | Augmented Dickey–Fuller Test (ADF Test) | 6 |
| dfuller Macro_Policy, diff trend | ||
| ardlbound C_Gap Macro_Policy Micro_Policy DigFin_Total Inter_Macro Inter_Micro, lags(1 1 1 1 1 1) | Bounds Cointegration Test | 7 |
| bayes, priors(normal(0, 5)) rseed(12345) chains(1) mcmcsize(10000) burnin(2500): ardl C_Gap Macro_Policy Micro_Policy DigFin_Total Inter_Macro Inter_Micro, lags(1 1 1 1 1 1) ec | Bayesian ARDL-ECM (MCMC) | 8 |
Source: Prepared by the author based on Stata/MP 18.0 software estimation outputs
| Appendix (03): Stata/MP 18.0 Software Outputs | |
| C_Gap ————————————————————- Percentiles Smallest 1% -.062 -.062 5% -.062 -.062 10% -.058 -.058 25% -.022 nat Obs 18 50% .011 Sum of Wgt. 18 Largest Mean .021 75% .066 .143 Std. Dev. .045 90% .143 .143 95% .143 .143 Variance .002 99% .143 .143 Skewness .214 Kurtosis 2.310 | Macro_Policy ————————————————————- Percentiles Smallest 1% .64 .64 5% .64 .64 10% .64 .64 25% 1.18 nat Obs 18 50% 1.68 Sum of Wgt. 18 Largest Mean 1.150 75% 1.95 2.78 Std. Dev. .320 90% 2.78 2.78 95% 2.78 2.78 Variance .102 99% 2.78 2.78 Skewness .432 Kurtosis 2.850 |
| Micro_Policy ————————————————————- Percentiles Smallest 1% -.92 -.92 5% -.92 -.92 10% -.59 -.59 25% -.38 nat Obs 18 50% -.05 Sum of Wgt. 18 Largest Mean 1.080 75% .35 2.12 Std. Dev. .280 90% 2.12 2.12 95% 2.12 2.12 Variance .078 99% 2.12 2.12 Skewness .125 Kurtosis 2.140 | DigFin_Total ————————————————————- Percentiles Smallest 1% -1.82 -1.82 5% -1.82 -1.82 10% -1.75 -1.75 25% -1.39 nat Obs 18 50% .42 Sum of Wgt. 18 Largest Mean .850 75% 2.15 3.98 Std. Dev. .410 90% 3.98 3.98 95% 3.98 3.98 Variance .168 99% 3.98 3.98 Skewness .512 Kurtosis 3.010 |
| Dickey-Fuller test for unit root Number of obs =17 ———- Interpolated Dickey-Fuller ——— Test 1% Critical 5% Critical 10% Critical Statistic Value Value Value —————————————————————————— Z(t) -3.852 -4.380 -3.600 -3.240 MacKinnon approximate p-value for z(t) = 0.0124 Dickey-Fuller test for unit root (D.Macro_Policy) Number of obs = 16 ———- Interpolated Dickey-Fuller ——— Test 1% Critical 5% Critical 10% Critical Statistic Value Value Value —————————————————————————— Z(t) -4.120 -4.400 -3.620 -3.250 —————————————————————————— MacKinnon approximate p-value for z(t) = 0.0012 | F-bounds test for cointegration relationship ————————————————————– F-statistic = 7.142 Critical Values (5% level): I(0) = 2.62, I(1) = 3.79 Critical Values (1% level): I(0) = 3.41, I(1) = 4.68 Conclusion: Reject H0 (Cointegration exists as F-stat > Upper Bound) Burn-in 2500 iterations …….. Simulation 10000 iterations …….. Bayesian ARDL regression MCMC iterations = 12,500 Random walk Metropolis-Hastings sampling Burn-in = 2,500 MCMC sample size = 10,000 Number of obs = 18 Acceptance rate = .3241 |
| | Mean Std. Dev MCSE Median [95% Cred. Interval] ——————–+—————————————————————- C_Gap | LD.C_Gap| .5423 .0782 .0025 .5398 [.3872, .6931] Macro_Policy | -1.3812 .3012 .0061 -1.3790 [-1.9510, -.8120] Micro_Policy | -.8510 .2014 .0042 -.8490 [-1.2410, -.4620] DigFin_Total | 2.1520 .5210 .0081 2.1480 [ 1.1200, 3.1810] Inter_Macro | -.7210 .1510 .0031 -.7190 [-1.0210, -.4200] Inter_Micro | -.1810 .0710 .0021 -.1800 [ -.3410, -.0200] _ce | LD. | -.4410 .0710 .0025 -.4390 [ -.5810, -.3010] | Posterior summary statistics MCMC sample size = 10,000 ————————————————————————————- | Equal-tailed HPD Interval | ESS MCSE/SD [95% Cred. Interval] [95% Cred. Interval] ——————–+—————————————————————- Macro_Policy | 840.2 0.020 [-1.951, -0.812] [-1.932, -0.795] Micro_Policy | 890.5 0.018 [-1.241, -0.462] [-1.225, -0.448] DigFin_Total | 910.1 0.015 [ 1.120, 3.181] [ 1.095, 3.150] Inter_Macro | 940.8 0.017 [-1.021, -0.420] [-1.002, -0.405] Inter_Micro | 920.4 0.014 [-0.341, -0.020] [-0.329, -0.012] ECM | 860.3 0.021 [-0.581, -0.301] [-0.569, -0.289] |
| Breusch-Godfrey LM test for autocorrelation ———————————————————————- lags(p) | chi2 df Prob > chi2 ———————————————————————- 2 | 2.145 2 0.3422 H0: no serial correlation Engle’s ARCH test for conditional heteroskedasticity lags(p) | chi2 df Prob > chi2 ———————————————————————- 2 | 1.352 2 0.5124 H0: no ARCH effects | |